Tag

FEBRUARY

Browsing
Photo courtesy of potzuyoko

In our interview on Monday, professional photographer Sally Wiener Grotta talked about using histograms to help determine the exposure she needs to best reflect her subject in a photograph. If you took any statistics in high school or college — or have helped a middle schooler with her math homework — you may know exactly what a histogram is. But do you understand how these graphs are helpful for photography?

In short, a histogram is a graph that demonstrates variance and frequency.  (Stay with me here. I know there are some strange, mathy words in there.) Here’s a really simple example:

The administrators of a health clinic are collecting data about the patients, so that they can provide the most appropriate services.  The histogram below shows the ages of the patients.

Even with one quick glance, it’s apparent that the clinic sees far fewer patients who are between 80 and 90 years old. In fact, it looks like the group that’s most represented includes those between 40 and 50 years old.

(If you’re really being a smarty pants, you might notice that the histogram follows the normal or bell curve. But you don’t have to know that to get along in everyday life — unless you work in statistical analysis.)

So here’s what’s special about a histogram:

1. The horizontal line (or axis) represents the categories (or bins). These are almost always numbers, and each one has no gaps. In other words, in a histogram, you won’t have categorical data, like people’s names. Notice also that the data is continuous. Someone who is 43 and 5 months falls in the 40-50 year old category.

2. The vertical line (or axis) represents the frequency or count of each category.  These are always numbers. So in the histogram above, 40 people who visited the clinic were between 80 and 90 years old.

3.  The bars of the histogram butt up against one another. That demonstrates the fact that there are no gaps in the data and the data is numerical.

4. The taller the bar, the more values there are in that category. The shorter the bar, the fewer values there are in that category.

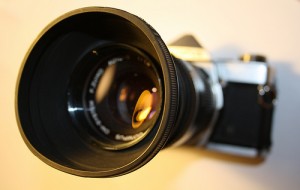
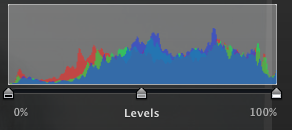
So let’s look at a photographer’s histogram:

First off, these histograms are automatically generated by imaging software or even some fancy-schmancy cameras. In other words, technology plots these values. It’s the photographer’s job to interpret them.

You probably noticed that there are no numbers on this histogram.  Like a statistical histogram, the vertical axis represents frequency.  But the horizontal axis doesn’t represent numbers. Instead, it shows shades.  Follow the bar at the bottom of the histogram from the left to the right.  Notice how it goes from black to grey to white? In fact, the bar gradually changes from black to white.

If you could blow up this histogram to a much larger size, you would see that it’s made up of lots and lots of skinny rectangles. These represent the number of pixels in the photograph that are each shade. So there are very few (if any) pure white pixels. There are some pure black pixels, but not as many as there are grey ones.

By glancing at this image, an experienced photographer can determine whether an image needs more or less exposure. There’s a great deal of artistry in this — a really dark photo can have a dramatic effect, while certain conditions require more exposure than others.

There you have it. Histograms aren’t just for statisticians. And those silly little graphs you drew in your middle school math class actually have artistic value!

Do you have questions about histograms? Ask them in the comments section!

Photography is one of those art forms that looks easy but is really challenging — at least challenging to get it done right!  Writer and photojournalist, Sally Wiener Grotta describes how math helps her compose the best photograph, including perfect lighting. 

Can you explain what you do for a living?

Essentially, I am a visual and verbal storyteller. This has developed into a multi-pronged career.

As a photojournalist, I have traveled all over the globe, visiting all 7 continents (including Antarctica several times) and many islands (such as Papua New Guinea and Madagascar) on assignment for major magazines and other publications. My current and ongoing fine art project is American Hands (www.facebook.com/AmericanHands) for which I am creating narrative portraits of individuals who are keeping the old trades alive, such as a blacksmith, glassblower, bookbinder, spinner, weaver, etc.  I travel around the county, mounting American Hands exhibits and giving presentations about the people I photograph.

In addition, I give lectures and teach master classes on photography and imaging. I recently launched a YouTube channel in which fellow photographer David Saffir and I discuss the essential elements that define a photograph and pull us into it, using the narrative power of shadow and light.

As a non-fiction writer, I have written literally thousands of articles, columns, features and reviews for major magazines, newspapers and websites, as well as seven non-fiction books. In non-fiction, I am primarily known for my expertise in testing, analyzing and explaining technology related to photography, imaging, printing and epublishing.

My first novel “Jo Joe” will be published this spring as both an eBook and printed book by Pixel Hall Press, followed later this year with other stories and books.

When do you use basic math in your job?

Math is integral to my work in many ways. An intuitive understanding of geometry is essential for good photographic composition. In addition, I use math to control exposure (the amount of light used to define a photograph) and to decide how to set up auxiliary lighting.

A prime example of math in photography and imaging is the histogram tool. The histogram is a graph that provides information analyzing the exposure of a photograph. When a photographer or digital artist looks at a histogram, it helps us understand the “dynamic range” of the picture. In other words, what percentage of the photograph is made up of highlights, shadows and midtones. If the graph displays that there is too much image data in, say, the highlights, and I know that the image is of a scene that isn’t that bright, I can then decide to change my exposure so the photo better represents the scene.

But basic math goes much deeper into my everyday career concerns. For instance, my American Hands project is a non-profit venture supported by grants and sponsors. When I apply for a grant, I must present an accurate, logical and meaningful balanced budget. Therefore, I have to calculate my costs over time and balance that against potential income. (If the budget isn’t balanced with income=costs, the grant application will be rejected.)

Another example of everyday math has to do with laying out books and journals for publication, such as my American Hands Journal. At the very basic, a typical book is printed in “signatures” of a specific number of pages each, such as 4-pages each. So a book must be laid out so that its total pages are a multiple of 4 (or whatever the signature number is). Then, there are spatial concerns, such as keeping type and photographs within specific printable margins, that requires more intuitive understanding of geometry.

Do you use any technology to help with this math?

I do believe that it is important to understand math and be able to do it without calculators or computers. However, when I use it for accounting, grants applications and such, I must be sure that I haven’t introduced an error, through a mistake in arithmetic or simply a typo. So, I may use a calculator. More often, I will use Microsoft Excel on my computer to create a spreadsheet that does automatic calculations for me when I input figures. However, I am the one who creates the rules for those calculations. So, using a spreadsheet doesn’t preclude the need to understand the underlying math.

How do you think math helps you do your job better?

Math isn’t only necessary in my career as an artist and writer, but it is also a skill that sharpens your mind the more you use it. That kind of precision thinking is a great complement to the creative side of my business, balancing it. What’s more, a sharpened mind is one that is more open and creative.

How comfortable with math do you feel?

I was lucky to have some wonderful teachers – starting with my mother before I ever went to school. She created basic arithmetic puzzles to keep me busy, and I learned to think of numbers as a game, starting when I was about 4 years old. So, I have long been comfortable with numbers and their relationships to each other. Math and art are not opposites. In fact, in the Renaissance, the great mathematicians were artists and vice versa. And, today, the great math innovators have highly creative minds.

What kind of math did you take in high school?

I studied geometry, algebra and calculus in high school.  I enjoyed it, again, mostly because I had good teachers. It continued to be a game to me to understand how numbers fit and changed each other.

Did you have to learn new skills in order to do the math you use in your job?

The new skills I developed since leaving school has to do with defining intelligent, useful calculation rules in an Excel spreadsheet. But it was all based on math I already understood, so it was relatively easy… once I understood how the spreadsheet works.

Do you have questions for Sally?  Ask them in the comments section!

Picasso’s Violin and Grapes (Photo courtesy of Ahisgett)

When my brother Graham was in kindergarten, he learned a little bit about Pablo Picasso.  And so my mother decided to take the whole family to a touring Picasso exhibit at the Smithsonian, which featured five or so of his paintings, including some of his most famous examples of cubism.

My brother is a man of few words, and he wasn’t any different as a little boy.  He quietly walked around the paintings, looking intently at them and being careful not to cross the red velvet ropes that kept out curious hands.  Nearby, we were all watching Graham, wondering what in the world he was thinking.

That’s when he stepped back from one of the paintings and said, “Oh, I get it.” We waited for something insightful. He pointed to the velvet ropes and said: “The paint is still wet.”

Cubism is not the easiest kind of art to understand.  But you have to admit — whether you like it or not — cubism catches the eye.

In cubism, objects are deconstructed, analyzed and reassembled — but not necessarily in their original order or size. When this is done in painting, the result is a three-dimensional object reassembled in a two-dimensional space, without regard to what can actually be seen in the real world.  So while you can’t see the back of a violin when you’re looking at the front, Picasso may depict the back and front at the same time in the same two-dimensional space.

Freaky, right?

I’ll leave it to the art experts to explain why this works.  But I can talk a bit about the

Portrait of Pablo Picasso by Juan Gris (Photo courtesy of Raxenne)

the geometry of cubism.

First, you need to know that cubism has its roots in the work of Paul Cezanne. He began playing with realism, saying he wanted to “treat nature by the cylinder, the sphere, the cone.”  In other words, he began replicating these figures as he saw them in his subjects.

Henri Matisse, Picasso, and others took Cezanne’s approach even further.  It’s not hard to recognize the cubes and angles and spheres and cones.  But it’s the flattening of three-dimensional space and disregard of symmetry that really distinguishes cubism from realism or impressionism.

Symmetry is a very common occurrence in mathematics.  From symmetric shapes to the symmetry of an equation (remember: what you do to one side of an equation, you must do to the other!), it’s fair to say that when symmetry is absent, it’s a big deal.

And the same is true for nature, the most often referenced subjects in art.  A face, a water lily, the body, a beetle — you could spend all day finding symmetry in the natural world.  Cubism turns this notion on its head.

And still, the pieces are compelling.  It’s that dissonance that draws our attention and even illustrates difficult subjects. (Picasso’s most enduring and controversial pieces is Guernica, a large painting depicting the Nazi bombing of a small Spanish town.)  The artists do this by breaking traditional rules and ignoring some mathematical truths.

Do you like cubism? Have a favorite artist? When you’ve seen cubism in the past, did you think of it mathematically? Buy the math books that will help you learn math for practical purposes, the math that you will use in your everyday life.

Sketch courtesy of anyjazz65.

My middle school daughter aspires to be a fashion designer, and so she’s been concentrating lately on learning to draw female human figures.  Last Friday, she came home from school and immediately logged on to the internet in search of a “how to draw” tutorial.  She spent the next several hours engrossed in aYouTube video that not only demonstrated how to draw the ideal human figure but offered some interesting tricks of the trade.  For example:

  1. The ideal figure is eight heads tall.
  2. The width of this figure’s shoulders is typically two heads — arranged horizontally — wide.
  3. The width of this figure’s hips is typically two heads — arranged vertically — wide.
  4. The top of this figure’s inseam (or the “bend” of the figure) is four heads tall or half a person’s height.

That’s right! Your own body can be sketched based on the size of your head!

What does it have to do with math?  This approach to drawing is based on proportions, and it depends on a relative unit.  In other words, the entire figure can be drawn based on one relative measurement — the size of the figure’s head.

(Here’s an interesting video that shows how to draw these figures by first folding the page in half longways and then in eighths along the short side. Great use of proportions!)

This approach allows great flexibility.  For example, men are typically taller than women, but their heads are also typically larger.  Therefore, the unit for a male figure will probably be bigger than a unit for a female figure.

In addition, artists can use this one unit to draw figures of varying sizes — tiny in one drawing or huge in a large-scale piece — simply based on this one unit.  All they need to do is draw the head first.

This photograph demonstrates foreshortening. Notice how the angle of the shot makes the feet seem much larger than the head. (Photo courtesy of hunnnterrr.)

It’s important to note that no one has a perfectly proportioned body.  Some people may be only 7.5 heads tall.  Or perhaps their legs are not half their height. Or maybe they have a long waist.  And the angle at which a figure is positioned will affect these proportions.  Objects that are closer seem larger, while objects that are farther away seem smaller. This is called foreshortening.

And of course anything can be used as the unit measure.  Have you ever seen an artist look at her subject over an outstretched brush or pencil?  This is a common method of measuring the figure from that particular angle.  An artist using the photograph to the left might notice, for example, that the subject’s right foot is three heads high.

The pencil or brush can also be useful in determining angles.  Two pencils can be held up to form the angle made by the figure’s arm and torso and then checked against that angle in the drawing.

All of these techniques are based on the properties of similar figures.  If two figures are similar, they have the same shape, but are proportional in size.  Remember your geometry class, when you proved that two triangles were similar, using the SSS, SAS and ASA similarity theorems for triangles?  (If not, don’t worry.)  They boil down to one important fact: all of the corresponding sides of similar figures are proportional, while all of the angles of those figures are the same measure.

But here’s the thing: artists probably don’t think too much about that.  My daughter hasn’t even studied similarity yet, but she’s able to figure out how to draw a human figure.  Once again, we’re using math without knowing the reasons behind it.  And that’s okay. It’s enough to know that it’s there.

Do you draw?  Have you attempted to learn to draw but not understood how to get the proportions right? Does having some of these rules help?

y birthday is this week, and I’ve decided I don’t want to work so hard. So today, I’m bringing you three archived Math at Work Monday interviews–two artists and a museum curator.  Enjoy!

Shana Kroiz: Jewelry artist

Shana has been designing museum-quality jewelry for almost 20 years.  She also began the Maryland Institute College of Art (MICA) jewelry department, when she was fresh out of college.  Using a combination of resin molds, metals and gemstones, her pieces are distinctive and tell interesting stories.

drawer #4 from Marcum’s “collections” series

Ursula Marcum: Glass artist

Ursula isn’t a glass blower, like Elizabeth Perkins.  Instead she works in kilnformed glass, creating layered pieces that truly unique. She uses various formulas to create her pieces, allowing different kinds of glass to fire at different temperatures and for different lengths of time.

An installation at the BMA.

Ann Shafer: Museum curator

Ann is the associate curator of the prints, drawings and photographs department at the Baltimore Museum of Art.  Part of her job is acquisitions, so she helps manage a budget — making sure that the museum has a balanced collection and spends its donations wisely.

Enjoy the interviews. See you on Wednesday!

Samantha Hand, plein air painting

Sam doesn’t remember this, but when she and I were in middle school, I used to ride home with her on the bus after school, when we’d watch Godzilla on television and eat her mother’s homemade potato bread.  At that time, she said she wanted to be a veterinarian (like her dad).  Instead she earned a BA in art and then her MFA. Since 2010, she’s discovered her talent in oil painting.  

Samantha Hand has some mad skills when it comes to oils and canvas. And even I was surprised by the math that she uses.  Unlike most of the other folks I’ve interviewed for Math at Work Monday features, Sam really counts on being able to visualize the math she needs.  Read on…

Can you explain what you do for a living?  For the last two years, I have completely immersed myself in oil painting and have tackled landscape, plein air, still life and portraiture. Currently I am painting compositions that intrigue me in hopes of selling them, while accepting commissions on a variety of subjects. Recent projects include still life and figurative painting.

When do you use basic math in your job?  I use the most math at the beginning stages of a painting. When I am sketching thumbnail ideas, I use the rule of thirds to compose a more interesting picture. I use a variety of angles to draw the eye toward the focus of the picture and to lead the eye around the composition. I also use angles in drawing perspective when I am attempting to create depth in a two-dimensional space. (For example, the angle of a building is wider in the foreground and will go toward a vanishing point as the building retreats into the distance)

If the composition is complex, as in a triple portraitI am currently working on, I use a grid to enlarge smaller reference images to the larger size of the canvas. This helps to keep the proportions of the sketch on the canvas accurate. Proportions are also important in balancing the values and subject matter in a composition. I check to see if the proportion of dark values is greater or lesser than the proportion of light values to add interest.  I may balance the visual weight of the subject with a greater space of sky to create visual tension or to draw the eye toward the subject.

Mr. Allison’s Hat

When I am sketching the figure I am constantly checking my proportions by comparing the size of body parts. For example, in most faces the space between the eyes is the width of one of the eyes in the face. Also, in general, people are approximately 6 and a half heads tall. I use a paint brush or pencil to measure and compare. I also use this measuring and comparing in all other subject compositions to check my spacing and proportions.

Once I begin painting, I use ratios in the mixing of colors. If I am looking for a purple I may mix an equal amount of red and blue. But if I want a warmer purple with a reddish tint I’ll use less blue in the mixture. Throwing in the amount of yellow equal to the red will turn it toward a brown. Equal measures of red, blue, yellow becomes a neutral gray. There are infinite numbers of colors to be mixed which is one of the most exciting things about painting.

Do you use any technology to help with this math?  I do not use a calculator or computer because the math I use is simple and not very exact. It is more about the feeling of balance or rightness. If something doesn’t feel right with the composition I begin to check using more exact measurements and angles.

How do you think math helps you do your job better? Math is the building block of my compositions. I use angles and proportions to try and create intriguing compositions with believable subject matter.

No. 5 tiara

How comfortable with math do you feel?  I am very comfortable with the math I use in my artwork but less so with the everyday math of a household. Somehow I feel as if I can visual the math I use in compositions and it makes sense to me. When I apply it to household tasks I have to really focus on the task at hand.

What kind of math did you take in high school?  I only vaguely remember my classes in high school but did take math analysis, geometry and the other algebra courses offered. I really enjoyed my math classes and felt confident in my ability, though less so with geometry. I continued with a calculus course in the first year of college and enjoyed that also. Unfortunately, I think I’ve only retained very simple math skills.

Did you have to learn new skills in order to do the math you use in your job?  I haven’t had to learn any new skills yet but I have learned to use the math I know in tangible situations.

Did you have any idea about the math that goes into planning a painting? If you have a question for Samantha, ask it in the comments section.

This month, Math for Grownups has gone arty, taking a close look at how math shows up in the visual arts.  Last week, glass blowing took center stage.

Since interviewing Elizabeth Perkins for Math at Work Monday, I have been obsessed with the process of glass blowing.  I’ve watched videos and read about the step-by-step process.  I still don’t know much — this stuff is complicated! — but there are a few little math connections that I made here and there, and I thought I’d share them with you.

First off, there are the tools.  The steel pipe that holds the glass is a very long cylinder or straw.  The hole allows the artist to blow air into the glass at one end, which creates the bubble.

Photo courtesy of runneralan2004.

Then there are not one, not two, but three furnaces.  Why three?  Because the entire process requires different levels of heat.  The first furnace contains molten glass.  The second, called the “glory hole” is used to reheat the piece as it’s being formed.  And the third, which is called the “lehr” or “annealer” is used to cool the piece very slowly and deliberately so it maintains structural soundness.

This is the furnace called the “glory hole.” (Photo courtesy of Brian Hillegas.)

The artist is constantly working against temperature changes.  When the glass is in liquid or semi-solid state, its shape can be changed, and this is accomplished by spinning the pipe. To achieve a symmetric shape, the glass must be spun in consistent circles.  This is where the bench comes in.  The glass blower can place the pipe along two parallel arms and push the pipe out and in.  Because the arms are parallel and the same height from the floor, the glass can be spun consistently.

There’s a lot happening in this picture, but notice that the two arms of the bench are parallel and equidistant from the floor. That keeps the pipe parallel to the floor and the glass spinning in a symmetrical, consistent shape. (Photo courtesy of focal1x.)

Okay, so we have some geometry (the pipe and the bench) and measurement (the furnaces regulated at different temperatures).

Time for more geometry.  After the glass blower gathers a layer of glass on the end of her pipe from the first furnace, she rolls it on a table to give it a cylindrical shape.  Blowing into the pipe creates the bubble — which eventually will become the curve of a bowl, glass, lampshade or something altogether different.  How that bubble is formed is critical to the stability of the piece.  The glass must be thicker around the bottom and thinner along the sides.

And this is where things get really mathy.  See, the bubble at the end of a glass blower’s pipe is usually some kind of ellipsoid.  You already know what an ellipsoid is.  You live on one: planet Earth. An ellipsoid is like a slightly flattened sphere.  In fact, a sphere is a special kind of an ellipsoid.

After the glass blower completes the piece, it goes into the annealer, which is programmed for that particular piece of glass.  Some pieces need to cool more slowly than others, and that cooling process is dictated by math.

So there you have it — my very uneducated look at the math of glass blowing.  You too can see math in everything, if you just look closely enough.

Are you noticing math in art? Share your observations in the comments section.

Elizabeth Perkins with “The Miller’s Lie/I Love America”

I’ve known Elizabeth Perkins since she was about 16 years old, I think.  In fact, I’ve always called her Beth.  

I was Beth’s geometry teacher way back when.  And I was so excited to find out that she’s now a very successful glass artist.  After graduating from Atlanta College of Art in 1997 with a degree in sculpture, she embarked upon an amazing journey as an artist and teacher.  She earned her MFA from Virginia Commonwealth University in 2004. 

Like me, Beth grew up in a rural, southern town and has a very strong connection to her family, so I’m really moved by her work, which incorporates glass, found objects and heirlooms.  But you know what I’m going to say next: The fact that Beth uses math in her art is both surprising and expected.  Read on to learn more.

Can you explain what you do for a living?  I work as a production glass blower for a company called Glassybaby and in addition serve as a contractual glass blowing and artist assistant to other professional artist here in Seattle.  I also continue to make my own sculpture primarily in glass and am able to teach workshops in my specific area of expertise at Pratt Fine Arts Center.

“Glass Lace Mural” (100% cast glass: pate de verre)

When do you use basic math in your job?  I use math all the time in my job.  One of the primary areas  is in creating and writing annealing programs.  This is the process where glass is cooled slowly so that it can cool evenly from the outside to the inside.  This differs depending on a glass’ annealing temperature, the thickness of the glass, size, and the thickness of the mold material (if you are casting glass).  The annealing programs are structured on the Fibonacci sequence, an integer sequence.

Do you use any technology to help with this math?  I usually do the math by hand, because I really have the need to visualize everything that I do.  The math result (which is usually in diminishing time increments per hour) is then called the annealing program for your glass project, which for me as an artist changes with most every piece — because I rarely repeat any image.  The annealing program is then put in to a controller.  The controller works on a relay to turn on and turn off the electricity in the heating elements inside an annealer or kiln.  Some controllers are set up to combine the time per hour cumulatively and some are not.  So I sometimes adjust the type of program based on the controller I am using.  All of my mold materials, as well as glass, are measured when creating castings, so that the ratios are correct. This insures that the “investment” (mold body) is as strong as it can be, to hold up to temperatures up to 1600 degrees.  Measuring the glass is also important so that the mold is completely filled but not overfilled. (If a mold overflows, that can ruin the kiln.)

How do you think math helps you do your job better?  Without math, I would be very wasteful with time and resources.  Math helps to create little science experiments in my daily artistic practice, as well as a strong control for testing firings and materials to get the best outcome in my work.  When I am working on a project, I keep detailed notes of all of my recipes for investment bodies and glass and the temperature that each glass moves.  Because all glasses and all colors of glass have a different material composition and they move at different rates and temperatures.  The firing and annealing schedules also are included variables in these experiments.  These are all the things I deal with on a daily bases that have everything and nothing to do with the image I am trying to convey in glass.  Every sculpture includes created and solved math problems.

How comfortable with math do you feel?  I have always, well, just not been very strong in math.  I use it everyday though.  I am one of those people that feels comfortable with patterns and shapes.  So perhaps I am more comfortable managing things like the Fibonacci sequence as well as geometry in my art practice problems.  I find now that my measuring has come so routine that I can feel the investment body when it is wet and know if the ratios are right and kind of fudge it with smaller sculptures.  With larger sculptures I can’t take those shortcuts.   I often use the old woodworker’s rule of measuring twice and cutting once.  I always check and re-check my math.

“Invisible Threshold” (kiln cast glass, heirloom, wood)

What kind of math did you take in high school?  I took the required math but no advanced math courses.  I liked geometry, but I never felt like I was ever good at math or liked it.  But I think for this reason I have a deep satisfaction when I am able to figure out these strange solutions to artistic problems.  I once became obsessed with figuring out the physics involved in the weight differential of glass on the end of a glass pipe.  (Glass pipes have a standard length but the material amount varies depending on what you are making, and it is constantly changing form while you are making it.)

Did you have to learn new skills in order to do the math you use in your job? Yes. I had to build on very basic math skill sets, only because I was unable to comprehend much of math.  I do think because math is necessary for what i do I am even more motivated and eager to find solutions.

I am a skilled, talented, and a creative artist, I feel very good about that and very proud.  I feel very honored that the math teachers I had in high school somehow managed to create “a current between the wires.” But I guess even a pickle can carry current. I use lots of math on a daily basis, and without their lessons I would not be able to make my work at all. While math is not my lover, it’s certainly a confidant. It’s always got my back.

And without Beth, I may not have felt like a great teacher.  Have questions for Beth?  Feel free to ask them in the comments section. 

All month, we’ll be talking about art and talking to artists.  So stay tuned — and fall in love with the math of art.

Photo courtesy of iaindc

Last night, my family and I had a real treat. In the midst of an impossibly busy week, we took time out to sit in a darkened theatre and be transported to another land and another time.  As the lights dimmed and the orchestra swelled, we were suddenly in 1905 Russia, with Tevye, his wife Golde and their five daughters.  The man sitting next to me hummed along with every song, and I mouthed the words.  Like much of the rest of the audience, I found myself grinning at Tevys’s dancing–and crying when he declared his daughter, Chava, dead to him.

*sigh*

This morning, the tunes from Fiddler on the Roof are still running through my head.  For me, there’s not much more inspiring and beautiful than a staged musical.

One my family’s resolutions this year is to see more theatre.  And we’ve made good on that promise already.  In January, we saw Arsenic and Old Lace and a community college production of Greater Tuna. I’m not sure what’s next.

Like many folks, I believe art (of all kinds) provides the gorgeous background to a sometimes drab world.  Art makes me think, while invoking emotions that can be otherwise hard to access.  I’ve found myself moved by Pyotr Ilyich Tchaikovsky, Martha Graham, Edgar Degas, Mary OliverAmy Ray and Oscar Wilde. Art has become a centerpiece of my daily life.

But if you grew up thinking that art and mathematics were mutually exclusive entities, I hope you’ve been disabused of that notion.  If not, stay tuned.

Here at Math for Grownups, February is all about art.  I’ll introduce you to some amazing artists — like Elizabeth Perkins, one of my former math students, who is now a highly conceptual glass artist.  These creative souls will help make the connections between art and math.

And we’ll delve into some of the more esoteric aspects of mathematics that form the underpinnings of natural beauty, classic art and modern music–like symmetry, the golden ratioand Fibonacci’s Sequence.

If art provides the beauty of the world, math describes it.  From poetry to glass sculptures to song, math is at the heart of all artistic endeavors.  I hope you’ll join me this month as we uncover the beauty of the world around us–with math.

What is your favorite artistic form?  Music, paintings, theatre, writing? Share your thoughts about math and art in the comments section below. And if you’ve always had a question about the connections between art and math, ask.  I’d love to explore the answer in a post this month.Save