

Things are looking bad for those of us in Hurricane Sandy’s path. Like most of my neighbors I spent the weekend cleaning up the yard and cleaning out the local grocery stores. But one thing is certain: In a short while, my electricity will be out, and I can expect to be living like Laura Ingalls Wilder in the city for at least a few days. That means no computer, no internet.
So for part of this week, at least, I’m bringing you some topical (not tropical!) highlights from posts past. First up is my interview with on-air meteorologist, Tony Pann. Here’s how he uses math in his work. (I’m betting he’s pretty darned busy this morning!)
Math at Work Monday: Tony the on-air meteorologist
I have been a television meteorologist for 22 years. Since 2009, I’ve been working as part of the morning team at WBAL TV.
When do you use basic math in your job?
I use math everyday! The computer models that we use to forecast the weather, are based on very complicated formulas derived from fluid dynamics. The atmosphere acts very much like a body of water, so the same mathematics can be applied to both. Each day, over a dozen different computer models are run predicting the state of the atmosphere at different time frames. An initial set of data is entered at a specific starting time, then the model shows us it’s interpretation of what the state of the atmosphere will be at certain time intervals. For example, the data might be entered at 7 a.m., then the model will predict the temperature, wind speed, and barometric pressure at 10 a.m., 1 p.m. and 4 p.m. Some of these models are short range, and only extend out to 48 hours, while others go all the way out to 365 hours from the starting point!
So let’s say there are 13 models that do this same thing each and every day, two or three times a day. It’s my job as a meteorologist to interpret all of that data, and translate it into the very understandable and reliable seven-day forecast that you see on TV. With so much data out there, the intuition and experience of the forecaster is very important. Since each model takes in the same starting data, but is run on a different formula, they all come up with different answers. For example, one model might say the high temp for today is going to be 45 and another could say 50. Or one could predict 6 inches of snow and the other says 1 inch. It’s my job to decide which one is right and why.
Sometimes I don’t trust any of them, and I’ll do a quick calculation on my own. Here’s an equation that I can use to calculate the high temp for the day by hand:
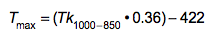


I then go on TV, and try and explain it all in an interesting manor — at least that’s the goal.
Did you have to learn new skills in order to do the math you use in your job?
In order to get a degree in meteorology, you actually have to learn all of the math that the computers are doing to give us those answers. It’s not easy! By the time we are finished, we’re just a class or two short of having a minor in mathematics. It’s great to know what the computers are doing, but I’m glad we don’t have to work it out by hand anymore. If not for the wonderful training in the world of mathematics, I most certainly would not be doing this job.
Do you have questions for Tony? Ask them in the comments section, and I’ll let him know to peek in! He’ll be a bit busy for a while, so be patient!

