49 Results

video

Search

Whether you’re flying across country or crammed in the mini-van for a trip to Grandma’s house, keeping a kid occupied on a long trip may mean you need a vacation at the end of it. And sure, we can plug them into movies or iPods or video games, but is that really what you want your children to remember about their trip to the Grand Canyon?

Being trapped in a car or plane or train for hours at a time will either kill you or make you stronger, and I’m rooting for stronger. You can look at this as an opportunity to hang out with your kids — and even sneak in a little math.

I know that sounds really, really geeky, but this was a real, live question that a parent asked me over at MSN.com’s Mom’s Homeroom where I’m the resident math expert. Since we’re talking travel this month, I thought I’d expand on the ideas here. The parent asked: “What are some fun math games that I can play with my 10 year old son and 7 year old daughter while on road trips?”

First and Last

This is a take on a game that I used to play with my daughter. She would say a letter, and I would say a word that began with that letter. Then she would identify the last letter of that word, and give me a word that began with that letter. For example: S prompted me to say spaghetti. She would say I and then igloo.

This can easily be adapted to math, which helps kids (and adults) practice their mental computation skills. For example:

First player: 16 + 3

Second player: 19

Second player: 19 – 10

First player: 9

First player: 9 • 3

and so on…

Set the rules of the game so that everyone can play. For example, no negative numbers, fractions or exponents, if your 13 year old is playing with his 8-year-old brother. Or tell them that they can only use even numbers or only addition and division. You might just find that your kids are getting really creative — and making some cool connections. (Did you know that when you add or subtract only even numbers, the answers will always be even?)

Road Sign Math

If you’re in the car, sometimes the only thing to read are road signs and license plates. But if you take a close look, you could find some math in there. In fact, someone has created a cool wiki devoted to this game. Take a look at the sign below.

Photo courtesy of Road Sign Math wiki

Do you see the math in there? It’s a very simple addition problem: 2 + 4 = 6.

These can get downright complex! But you can keep it easy for your younger kids. Look out for route numbers, license plates and billboards for more ideas. If you’re used to traveling the same road over and over, this is a particularly good way to pass the time. What’s old becomes new again!

I Spy

This perennial favorite can be adapted to all sorts of situations. For example:

“I spy with my little eye: a prime number!”

“I spy with my little eye: 17!”

I spy with my little eye: a fraction!”

Try this with a boring magazine on the plane. Keep the questions on grade level and offer encouragement for good — or close or creative — answers. Need to remember what a prime number is? If you’re not driving, do a quick search on your smart phone.

There are countless other ideas that can help you pass the time and inject a little math into the trip. Do you have suggestions? Offer them in the comments section!

I’m late posting today for good reason. I’ve been in New York City since Wednesday, attending the American Society for Journalists and Authors conference. And it’s been a blast! I rode up on the bus with hilarious humor writer, Michele Wojciechowski. I’ve met folks I’ve blogged for (including Debbie Koenig at Parents Need to Eat, Too) and folks who have been featured in Math at Work Monday (like career coach, Kiki Weingarten (and her sister Rachel Weingarten).

I’ve also attended workshops on creating video (look for that soon!) and being fearless in writing (with super mom blogger Jen Singer). Tomorrow, I’ll be moderating a panel called One Plus One Equals Cash: Math for Writers. Yep, I’m bringing the math message to my fellow freelance and book writers.

This little introvert is going to be exhausted by the time I get back to Baltimore on Sunday night. But I’ll also have a ton of inspiration — exactly the kick in the pants I need for the kind of isolated work I do.

Of course conferences mean dinners out with lots of people at one table. And in New York, this almost always means splitting the check ourselves, maybe even after a glass of wine or two! It’s a daunting prospect even for a former math teacher. So here’s a quick look at how you can do it, easily and without worry.

Dividing the Restaurant Check
1. Decide if you’re going to split everything evenly or if people want to pay only for what they purchased. Last night, I ate Indian with a group of friends. We chose to have a variety of dishes and share them family style. At the end of the dinner, we simply split everything seven ways.

2. Add the tip before you divvy things up. The server should receive 15% to 20% for good service on the entire bill. If you figure the tip after the division, you could end up tipping less than the server deserves. And — trust me on this — it makes the math easier.

(Remember how to find the tip? Take 10% of total bill by moving the decimal point one place to the left. For 20%, double that amount. For 15%, take half of that amount and add it to the 10%.)

3. Round. Unless you’re Mr. or Ms. Picky-Pants (and honestly, no one wants to eat dinner with someone like this), rounding is going to be close enough. But here’s the thing. You must round up. Otherwise, you could leave too small a tip or find out you don’t have enough money to cover the whole bill.

This rounding thing goes for both splitting options — dividing the check evenly or adding up each person’s total. But how should you round? Well, that depends on you and your comfort with the mental math. You can round to the nearest dollar (which is usually my preference) or to the nearest 50 cents. Use your best judgement — but pay attention to how your choice may affect others’ totals and the server.

4. Another option is to estimate. Last night our total bill was $156 with the tip. We had seven people, and I immediately noticed something wonderful — $156 is pretty close to $140. Why does that matter? Well, it’s because 7 x 20 = 140. (Okay, so actually I noticed that 7 x 2 = 14, but it’s basically the same math fact.) This meant that each of us would owe something close to $20.

Clearly we each owed more than $20, right? (156 is greater than 140.) So, I estimated that it would be pretty close to $23. Because I was thrilled to figure this out, I pulled out my iPhone and checked. Turns out $156 ÷ 7 = $22.29. My estimation pretty darned good!

5. And of course another option is to use a calculator. I am here to tell you that there is no shame in this! Look at it this way: you have lots of things on your mind, and that glass of wine probably isn’t going to help you do mental math. You’re a grownup, and your fourth-grade teacher isn’t looking over your shoulder telling you that calculators are bad. Use the tools that work for you.

6. Finally, when everyone has contributed, add it all up to make sure there’s enough to cover the bill. Several of us remember last year’s cocktail party when people left early but didn’t leave enough money to cover their drinks. That left the rest of us stuck with more than we expected to pay. Checking your answer is a great way to avoid these costly mistakes and tarnishing your good name!

Of course there are many other ways to approach these everyday — or every conference — problems. You just need to pick the one that works for your special brain. Remember, just because you do it differently doesn’t mean you’re wrong.

But I do encourage you to look at the relationships between numbers — even when you’re using a calculator. You might pick up a few neat tricks. And if you’re my age, it can’t hurt to exercise those brain cells a little.

How do you split the check at a restaurant? Have you ever said, “I’ll treat!” to avoid the math? Share your tricks here and feel free to ask questions, too.

Welcome week three of our month devoted to publishing and media. If you haven’t previous posts, what’s stopping you? So far, we’ve looked at book publishing and on-air meteorology (television weatherpersons). This week, it’s time to look at writing. Today you’ll meet Craig Guillot, a freelance writer in New Orleans, who specializes in finance writing, among other things. Craig is the author of Stuff About Money: No BS Financial Advice for Regular People, an ebook, which he says will be available in April. (I’m a source for one section!)

Bottom line? Math helps keep Craig profitable. So if you’re a budding freelance writer–or looking for ways to leave more on your bottom line–listen up.

Can you explain what you do for a living?

I’m a non-fiction freelance writer. My specialties include business, personal finance, retail, real estate, travel and entertainment. I’ve written for publications and web sites, such as Entrepreneur, CNNMoney.com, Washington Post, Nationalgeographic.com and dozens of trade publications. I also have a personal finance book Stuff About Money: No BS Financial Advice for Regular People.

When do you use basic math in your job?

In the actual writing, not much. Just like any other writer or journalist, I interview sources, research, take trips out in the field, gather information and write. I occasionally do a little photography and video too. I do use math on occasion in some of my personal finance work to demonstrate and calculate different things related to retirement and investing.

But I use math a lot in the background. Writing just happens to be my trade. Like any other self-employed person, I am ultimately running a business. As a freelancer I sell my services to editors and corporate clients. I have a lot of regular clients, but I’m constantly taking on new projects and new deals. I need to be able to carefully estimate my time and expenses to give a client an accurate quote.

To me, everything is about the hourly rate. I need to use this as a basis for building my income. And while my overhead isn’t much, I do have to know what’s going out to pay taxes, what’s going into savings, retirement and everything else. It may seem like part of my personal life but I consider it all part of my job. When you’re self employed, you have to constantly think about all of these things.

Do you use any technology (like calculators or computers) to help with this math?

I’m not sure I even have a calculator in my office anymore, but my main tool is Excel. I use it for everything, and I mean everything. It’s a calculator but so much more. There is no problem that can’t be solved, no analysis that can’t be made, in Excel. When you learn how to use it and how to write the formulas you need, you can do anything with it. I use it to analyze my revenues, analyze the profitability of certain assignments. Like everyone else, I use Quickbooks, but I also use Excel for background stuff.

I break everything down to a formula or percentage. This includes my monthly income goals. It doesn’t have to be that way. I don’t imagine it’s that way for many other writers but it works for me and helps me make the optimal decisions. I’ve used Excel to track, analyze and compute things in my regular life as well. I used it in the remodeling of our house, in tracking my net worth, in monitoring my investments, planning retirement, planning trips. I sit down, make up a spreadsheet, build some formulas, input the data and then use it to help make decisions. I run marathons and even use it to track my training runs and races. The more you learn how to use Excel and write formulas, the more uses you find for it.

How do you think math helps you do your job better?

One way it helps me is with analyzing my hourly rate and profitability. Whenever I take on special projects for a corporate client or a custom publisher, I use it to give a quote. I prefer to work on a project rate. I give them a single number but behind that is a lot of math that I have used to arrive at that number. They don’t need to know any of that.

I may also build in a variance. It will let me know if I might be able to live with a cut in that number. So if they want to try to negotiate that down a bit, I know that I can drop by 5%, 7%, 10% or whatever it might be for me to still make what I need to make.

I also need to factor in opportunity cost. That is what else I could be doing with my time. Do I take this project which will tie me up for three weeks or do I decline it and go after smaller but potentially more lucrative projects that will make my time more flexible? I use math to figure all this out.

How comfortable with math do you feel?

In relation to personal finance and business math, I feel very comfortable with it because I use it so much and see the value in it. But all the standard stuff you learn in school? I really don’t remember any of that. I’d have to pull out a book and look up some formulas if you wanted me to calculate cubic volume or something like that.

What kind of math did you take in high school?  Did you like it/feel like you were good at it?

Just the basics. Algebra, geometry, standard high school stuff. I wasn’t particularly good at it, I was just average. But I majored in business in college and took a lot of accounting, finance and business math classes. I always excelled at those and had a stronger interest in them. Math dealing with money just felt real to me. There was an instant connection of “Oh, I could actually use this someday.”

Did you have to learn new skills in order to do the math you use in your job? Or was it something that you could pick up using the skills you learned in school?

I did pick up some new skills, but a lot of the business and personal finance math I used today can be traced right back to college. The fact that I actually enjoy this kind of math really helps.

Anything else you want to mention?

Yes. I believe that many of our growing financial problems in this country—like people getting into mortgages they couldn’t afford, our lack of savings, our failure to put enough money away for retirement, our problems with credit card debt—can be traced partly to our failure to use math in our financial lives. People buy homes and cars on emotion but rarely run the numbers. They wouldn’t use debt to overspend if they really knew the long-term consequences. There is a numerical answer for everything in your finances. You have to know why that number is important, how to calculate it and how to use it.

Any questions for Craig? I’m sure he’d be happy to answer them!

You know when you were little and you got sick on your birthday? It’s not quite the same thing, but I was down and out yesterday — on Pi Day! (I didn’t even get to wear my “cool” Pi sweatshirt.) So I bring you these little tidbits a day late.

What’s Pi Day, you ask? Flip back to yesterday’s calendar: March 14 or 3-14. Now think about the estimation of π or pi: 3.14. Ta-da!

Here are a few ways folks have celebrated Pi Day, thanks to the watchful eyes of my wonderful Math for Grownups readers.

Amherst College, 2004: “On March 14, or 3.14, students celebrated National Pi day by waking up at 6 a.m. and burning through 15 sticks of sidewalk chalk. Here, digits of pi trail off in front of Fayerweather Hall on National Pi Day. 2,010 digits of pi stretched from Valentine Dining Hall to Merrill Science Center.”

Photo courtesy of Amherst College website

Are Shakespeare’s Plays Encoded With Pi? Vi Hart strikes again. (And yes, it’s in iambic pentameter. Genius!)

3.14 ways to celebrate Pi Day, from Carol Pinchefsky at Forbes.com. 

Sand Art Video: If you’re a child of the 80s (like I am) or just love Tommy Tutone, click on this.

Oh, and what does my π sweatshirt look like? It says: Now I need a verse recalling pi. Can you figure it out?

Did you celebrate Pi Day? Tell us what you did in the comments section.

Sketch courtesy of anyjazz65.

My middle school daughter aspires to be a fashion designer, and so she’s been concentrating lately on learning to draw female human figures.  Last Friday, she came home from school and immediately logged on to the internet in search of a “how to draw” tutorial.  She spent the next several hours engrossed in aYouTube video that not only demonstrated how to draw the ideal human figure but offered some interesting tricks of the trade.  For example:

  1. The ideal figure is eight heads tall.
  2. The width of this figure’s shoulders is typically two heads — arranged horizontally — wide.
  3. The width of this figure’s hips is typically two heads — arranged vertically — wide.
  4. The top of this figure’s inseam (or the “bend” of the figure) is four heads tall or half a person’s height.

That’s right! Your own body can be sketched based on the size of your head!

What does it have to do with math?  This approach to drawing is based on proportions, and it depends on a relative unit.  In other words, the entire figure can be drawn based on one relative measurement — the size of the figure’s head.

(Here’s an interesting video that shows how to draw these figures by first folding the page in half longways and then in eighths along the short side. Great use of proportions!)

This approach allows great flexibility.  For example, men are typically taller than women, but their heads are also typically larger.  Therefore, the unit for a male figure will probably be bigger than a unit for a female figure.

In addition, artists can use this one unit to draw figures of varying sizes — tiny in one drawing or huge in a large-scale piece — simply based on this one unit.  All they need to do is draw the head first.

This photograph demonstrates foreshortening. Notice how the angle of the shot makes the feet seem much larger than the head. (Photo courtesy of hunnnterrr.)

It’s important to note that no one has a perfectly proportioned body.  Some people may be only 7.5 heads tall.  Or perhaps their legs are not half their height. Or maybe they have a long waist.  And the angle at which a figure is positioned will affect these proportions.  Objects that are closer seem larger, while objects that are farther away seem smaller. This is called foreshortening.

And of course anything can be used as the unit measure.  Have you ever seen an artist look at her subject over an outstretched brush or pencil?  This is a common method of measuring the figure from that particular angle.  An artist using the photograph to the left might notice, for example, that the subject’s right foot is three heads high.

The pencil or brush can also be useful in determining angles.  Two pencils can be held up to form the angle made by the figure’s arm and torso and then checked against that angle in the drawing.

All of these techniques are based on the properties of similar figures.  If two figures are similar, they have the same shape, but are proportional in size.  Remember your geometry class, when you proved that two triangles were similar, using the SSS, SAS and ASA similarity theorems for triangles?  (If not, don’t worry.)  They boil down to one important fact: all of the corresponding sides of similar figures are proportional, while all of the angles of those figures are the same measure.

But here’s the thing: artists probably don’t think too much about that.  My daughter hasn’t even studied similarity yet, but she’s able to figure out how to draw a human figure.  Once again, we’re using math without knowing the reasons behind it.  And that’s okay. It’s enough to know that it’s there.

Do you draw?  Have you attempted to learn to draw but not understood how to get the proportions right? Does having some of these rules help?

Since interviewing Elizabeth Perkins for Math at Work Monday, I have been obsessed with the process of glass blowing.  I’ve watched videos and read about the step-by-step process.  I still don’t know much — this stuff is complicated! — but there are a few little math connections that I made here and there, and I thought I’d share them with you.

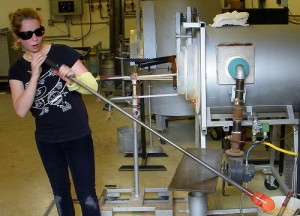
First off, there are the tools.  The steel pipe that holds the glass is a very long cylinder or straw.  The hole allows the artist to blow air into the glass at one end, which creates the bubble.

Photo courtesy of runneralan2004.

Then there are not one, not two, but three furnaces.  Why three?  Because the entire process requires different levels of heat.  The first furnace contains molten glass.  The second, called the “glory hole” is used to reheat the piece as it’s being formed.  And the third, which is called the “lehr” or “annealer” is used to cool the piece very slowly and deliberately so it maintains structural soundness.

This is the furnace called the “glory hole.” (Photo courtesy of Brian Hillegas.)

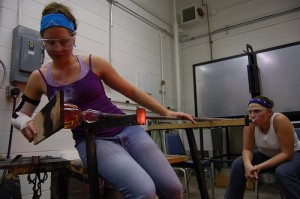
The artist is constantly working against temperature changes.  When the glass is in liquid or semi-solid state, its shape can be changed, and this is accomplished by spinning the pipe. To achieve a symmetric shape, the glass must be spun in consistent circles.  This is where the bench comes in.  The glass blower can place the pipe along two parallel arms and push the pipe out and in.  Because the arms are parallel and the same height from the floor, the glass can be spun consistently.

There’s a lot happening in this picture, but notice that the two arms of the bench are parallel and equidistant from the floor. That keeps the pipe parallel to the floor and the glass spinning in a symmetrical, consistent shape. (Photo courtesy of focal1x.)

Okay, so we have some geometry (the pipe and the bench) and measurement (the furnaces regulated at different temperatures).

Time for more geometry.  After the glass blower gathers a layer of glass on the end of her pipe from the first furnace, she rolls it on a table to give it a cylindrical shape.  Blowing into the pipe creates the bubble — which eventually will become the curve of a bowl, glass, lampshade or something altogether different.  How that bubble is formed is critical to the stability of the piece.  The glass must be thicker around the bottom and thinner along the sides.

And this is where things get really mathy.  See, the bubble at the end of a glass blower’s pipe is usually some kind of ellipsoid.  You already know what an ellipsoid is.  You live on one: planet Earth. An ellipsoid is like a slightly flattened sphere.  In fact, a sphere is a special kind of an ellipsoid.

After the glass blower completes the piece, it goes into the annealer, which is programmed for that particular piece of glass.  Some pieces need to cool more slowly than others, and that cooling process is dictated by math.

So there you have it — my very uneducated look at the math of glass blowing.  You too can see math in everything, if you just look closely enough.

Are you noticing math in art? Share your observations in the comments section.

Photo courtesy of Chibijosh

On Monday, I introduced you to Elizabeth Perkins, an up-and-coming glass artist in Seattle.  (She also happens to be one of my former students, but that is mere coincidence. I take no credit whatsoever for her success and talent.)  In her interview, she mentioned that she depends on the Fibonacci sequence to develop some of her annealing programs, or processes for cooling the glass so that is remains structurally sound.

But what the heck is a Fibonacci sequence?

Well, it’s a pretty cool list of numbers. And it’s also really, really easy to figure out. See for yourself:

0, 1, 1, 2, 3, 5, 8, 13, 21, ?

What’s the next number?

I’ll give you a chance to think about it.

Need a hint? Pick any number in the list (except for the first 0 and first 1), and look at the two numbers before it.

Get it yet?  (The correct answer is 34.)

The Fibonacci sequence is generated by adding the last two numbers together to get the next number.  Take a look:

0 + 1 = 1

1 + 1 = 2

1 + 2 = 3

2 + 3 = 5

3 + 5 = 8

5 + 8 = 13

8 + 13 = 21

13 + 21 = 34

Now that you know this rule, you could conceivably add numbers to this sequence until you got bored or exhausted (which ever comes first).

The fellow who discovered this sequence was, you guessed it, Fibonacci — an Italian mathematician and philosopher who was reportedly born in 1175 AD.  But to be honest, his sequence is not the greatest contribution Fibonacci (or Leonardo de Pisa) gave to humankind.  In fact, he is the father of our decimal system.  Yep, the fact that you can count the $5.23 you have in your wallet is due to a guy whose real name we don’t even know for sure.

But I digress.

The Fibonacci sequence isn’t just an easy and cool math fact.  It’s cool — and really, really important — because it shows up everywhere.  Here are just a few examples:

If you count the petals of various species of daisies, you’ll get one of the Fibonacci numbers.

The length of the bones in your wrist and hand are a Fibonacci sequence.

The spiral of a pineapple is arranged in Fibonacci numbers.

Branches of a tree grow in a Fibonacci sequence (one branch, two branches, three branches, five branches, and so on, moving up the height of the tree).

The gender of bees in reproduction mirrors the Fibonacci sequence.

Photo courtesy of Mr. Velocipede

And then there’s art.  Art loves the Fibonacci sequence.  Since the Greeks formalized what is beautiful in architecture and paintings, this little list of numbers has been front and center in a variety of artistic fields.

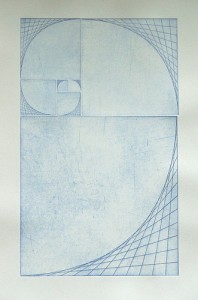
For example, this seven plate print is gorgeous and also represents something called the golden spiral.  The sides of each square (starting in the center with the smallest squares) correlate to the numbers in the Fibonacci sequence.  So, the smallest square has side length of 1 unit, the next largest is 2 units, the next is 3 units, the next is 5 units, etc.

Cool huh?

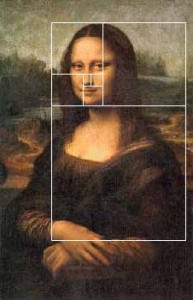
It gets better.  Remember the lady with the mysterious smile?  Leonardo da Vinci was fascinated by mathematics, and some folks have noticed that his lovely lady’s facial characteristics follow the path of the Fibonacci sequence.

Image courtesy of www.shoshone.k12.id.us

Do you see how the squares line up with the base of her eyes and  bottom of her chin, and surround her nose perfectly?

So there you have it.  What we see as beautiful could very well be because of mathematical wonders like Fibonacci’s sequence.  And as Beth the glass blower shows, this magical little list of numbers is useful in the science of making art as well.

Earlier this year, I posted a really, really cool video about the Fibonacci sequence in nature. Check it out here.Save

Photo courtesy of Pinti

January 2012 seems extra long!  In fact, there are five — count ’em, five — Mondays in this month.  And while I’ve never missed a Math at Work Monday, I decided to take a break this week.  (Want to read up on previous Q&As for this month? Check them out:  Robert the exercise physiologist, Janine the professional organizer, Jameel the budget counselor and Kiki the career coach.)

This month has been all about New Year’s Resolutions: getting in shape and getting organized, boning up on budget basics and becoming your own boss.  But what are our chances of actually succeeding in any (or all) of these things?  Once again, I ask you: let’s look at the math.

According to a 2008 survey conducted by author and motivational speaker, Steven Shapiro and the Opinion Research Group (Princeton, NJ), 45 percent of Americans set New Year’s Resolutions, but only 8 percent of these reach their goals each year and 24 percent say they never keep their resolutions.

(Disclaimer: I really can’t vouch for the veracity of this study, because I can’t find the data.  But let’s go with it, just to prove my point.  The numbers aren’t really all that important.)

How many of you read those statistics and thought: “Well, there’s no point in even making resolutions! With chances like those, I’m doomed to fail!”

Here’s the good news: If you nodded your head, you are not alone.  And here’s the better news: Statistics don’t work that way.

It’s easy to look at stats and think that they must be true and must apply to everyone in every situation.  Cold, hard numbers don’t lie, right?  Maybe the numbers don’t lie, but it sure is tempting to use those numbers to describe something that isn’t true.  (Politicians do it all the time.)

There are a couple of ways to describe this particular fallacy.  But I think one of most important is to consider what is known as independent events.  See, each person who sets a New Year’s Resolution is independent of all of the other people who do the same thing.  (Even if you’re all making the same resolutions.)

And it gets even trickier.  Each year that you set a resolution is independent, and each resolution that you set is also — you guessed it — independent.

In other words, your success probably doesn’t have much of anything to do with how well others have followed through on their yearly goals — or even how well you’ve done in years past.  (I say probably, because you may be one of those folks who is easily influenced by statistics.  In other words, you may decide that you cannot succeed in meeting your resolutions, simply because you read somewhere that most people don’t.)

There’s tons of research out there on why people make resolutions and how they can be successful in them. If you looked at this research and determined that you have many of the same obstacles, maybe — just maybe — you could predict your chance of success.

But simply because many other people aren’t successful doesn’t mean you are automatically doomed to fail. Independence is only one reason for this.  Randomness is another.

Dice are random, but people aren’t.  (In fact, I saw a great video that demonstrates this last week.  Of course I can’t put my hands on it now, but I’ll post a link, if I do.)  While a (fair) die only has to worry about gravity, we have many more things that influence our behavior, decisions and more.  That doesn’t mean that people aren’t more likely to act a certain way under certain conditions.  But it certainly does mean that your New Year’s resolutions are not beholden to statistics.

So, the next time you read an article about the low rate of success with New Year’s Resolutions, remember this: You certainly can succeed — even if you failed last year. And if you are philosophically opposed to New Year’s resolutions, you’ll need a better reason than most people don’t keep them.

How are you doing with your New Year’s Resolutions?  Share in the comments section.  And come back on Wednesday — I’ll reveal how things are going with me!Save

elebrate Christmas, you’re heading into the home stretch!  As of this morning, there are nine days until the fat man comes down the chimney.  I hope you’re more ready than I am!  (My careful schedule has gone to pot, in some ways, derailed by a sick kid, aging dog and some unexpected work stuff.  But I’m getting back on track.)

If you’ve hung out with me here at Math for Grownups for a while, you know how much I love Vi Hart.  This chick is something else — a musician and a “recreational mathematician.”  (According to her site, she now calls herself a recreational mathemusician.)

In short, Vi is the daughter of a math professor and a wonderful musician in her own right.  She creates these really, really cool videos that explore the intricacies of mathematical concepts — from number theory to geometry.

Yeah, she’s a huge geek, but she’s one of those geeks who won’t make you feel dumb, and she’s funny.

This week, I came across her video, The Gauss Christmath Spectacular.  (Gauss was a 16th and 17th century mathematician who dabbled in a huge array of topics, from optics to statistics.)  There’s some stuff in here that will probably fly right over your head, but don’t let that discourage you.  Instead, grab a cup of eggnog, plop your favorite high school or college student next to you, and jot down the math that you do recognize.  You’ll probably surprise yourself.

Without further ado, Vi Hart’s take on the 12 Days of Christmas (my absolute favorite Christmas song when I was five years old — much to my parents’ dismay).

What did you recognize?  Show off in the comments section!

Photo courtesy of luca pedrotti

As I announced earlier this week, I’m retiring Film Friday.  While I had a lot of fun looking for videos to share with you, the posts didn’t get a lot of traffic.  Remembering that insanity is doing the same thing over and over again while expecting different results, I’ve decided to get off this merry-go-round.

That doesn’t mean I’ll never include videos again.  In fact, I’d like to do video posts where I’m actually on screen to teach you a few things.  But for now, I’m taking a different route.  (Get the details here.)

So for today, we bid adieu to Film Friday here at Math for Grownups.  And as a parting gift, I share my favorite videos with you!

This video is so gorgeous.  I could watch it over and over again. (And I have.)

Ursus Wehrli is both infuriatingly precise and hilarious.

Do you remember the difference between the deficit and the debt ceiling?

In her quest to convince me that math is a stupid subject, my daughter started playing a little game with me last year.  She really thought she could come up with something that doesn’t have to do with math.  For a couple of days, she shouted words at me — like “flowers,” “air,” “water,” “running” — and I easily explained how math was important in each one.

That’s when we first started talking about the Fibonacci Sequence, which is nothing more than a sequence of numbers that go on forever and ever: 1, 1, 2, 3, 5, 8, 13, 21, … If you look at the sequence carefully, you can guess what the next numbers are.  But did you know that the Fibonacci Sequence is found everywhere in nature?

This video is a really cool look at this phenomenon, as well as other applications of math in nature.  And you don’t need to understand the math to appreciate the beauty.  Just take a look and enjoy.

What math did you recognize, if any, in the video?  Anything in particular you found interesting or beautiful?  Share in the comments section.