y birthday is this week, and I’ve decided I don’t want to work so hard. So today, I’m bringing you three archived Math at Work Monday interviews–two artists and a museum curator. Enjoy!
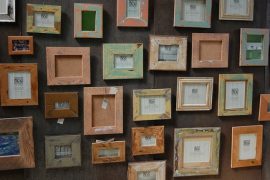
Shana has been designing museum-quality jewelry for almost 20 years. She also began the Maryland Institute College of Art (MICA) jewelry department, when she was fresh out of college. Using a combination of resin molds, metals and gemstones, her pieces are distinctive and tell interesting stories.
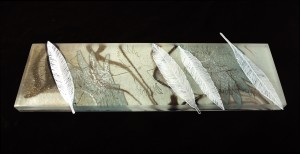
Ursula isn’t a glass blower, like Elizabeth Perkins. Instead she works in kilnformed glass, creating layered pieces that truly unique. She uses various formulas to create her pieces, allowing different kinds of glass to fire at different temperatures and for different lengths of time.
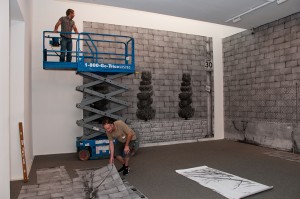
Ann is the associate curator of the prints, drawings and photographs department at the Baltimore Museum of Art. Part of her job is acquisitions, so she helps manage a budget — making sure that the museum has a balanced collection and spends its donations wisely.
Today, I bring you an excerpt from my book, Math for Grownups. Enjoy! (Now you have your weekend project planned for you.)
Hanging pictures can be a tricky business. If you’re not careful, your foyer can look like a hall of mirrors—with crooked photos of your wedding party alongside drawings that your kid made in kindergarten. Not to mention the holes in the drywall from when you realized that you hung your college diploma so high up the wall that only a giant could read it.
Not exactly the look you were going for?
You may not want to face it, but a tape measure, pencil, and yes, even a level, are your best buddies in home decorating. And hanging anything on your walls is no exception. Let’s look at this in a bit more detail.
Mimsy Mimsiton is thrilled to have finally received the oil portrait of her dear Mr. Cuddles, a teacup poodle who is set to inherit her large fortune. The painting will look fabulous above the marble fireplace in the west-wing lounge of her mansion.
But drat! The museum curator Mimsy has on retainer is in Paris, looking for additions to Mimsy’s collection of French landscapes. (She’s redoing the upstairs powder room and wants just the right Monet to round out the décor.)
But the painting must be hung before Mr. Cuddles’s birthday party. His little poodle friends would be so disappointed not to see it! There’s no way around it; Mimsy’s poor, overworked House Manager must hang the painting herself.
Luckily, House Manager is no stranger to the DIY trend, and Butler will be there to help. The two meet in the lounge, where the painting has already been delivered—along with a stepladder, a tape measure, and a pencil. Once House Manager marks the spot, Handy Man will come along to safely secure the painting to the wall.
House Manager and Butler get to work. First they measure the painting: With the gilded frame, it’s 54″ tall and 60″ wide.
Next, they turn their attention to the space above the mantle. House Manager climbs atop the ladder, while Butler holds it steady. From the ceiling to the top of the mantle is 84″. The width of the mantle is 75″.
Climbing down from the ladder, House Manager notes that the painting will certainly fit in the space allotted. She knows from experience that it is to be centered over the mantle. However, Mimsy will have a fit if the painting is centered vertically—between the ceiling and the mantle. No, the bottom of the painting must be exactly 12″ above the mantle.
So how high should Handy Man install the picture hanger?
To find out, House Manager must add 12″ to 54″ (the height of the painting). The top of the painting should be 66″ above the mantle.
House Manager grabs her tape measure again and removes the freshly sharpened pencil from behind her ear. Then she climbs the ladder. Starting at one end of the mantle, she measures 37½”—which is half the width of the mantle. She makes a barely visible pencil mark at that point.
Then from there, she measures up the wall to 64″. Again, she carefully makes a faint pencil mark.
If House Manager stopped here—leaving that small mark for Handy Man to hang the portrait—she’d probably be out of a job. That’s because she’s merely marked the top of the frame, not where the hanger should be secured.
She descends the ladder and goes back to the portrait. Turning it around, she notices the picture wire that has been stretched from one side to the other. She hooks her finger under the center of the wire and pulls up gently—creating an angle, as if the picture wire were hanging on a nail. Now an angle is a two-dimensional figure formed by two lines (called rays) that share a common point. Hereʼs an easier way to remember this: An angle looks like a V.
If she can measure the distance from the top of the frame to the vertex—the point where two sides of an angle meet—she’ll be in business.
There’s just one more thing to consider: Is the vertex of the angle too far to the left or too far to the right? For the painting to hang straight and be centered on the mantle, the vertex must be located at exactly half the width of the portrait.
House Manager uses her tape measure to find the length of each leg of the angle. In other words, she measures the distance from one end of the picture wire to the vertex of the angle and then the distance from the vertex of the angle to the other end of the wire. If the vertex is centered properly, the legs of the angle will have the same length.
Moving her finger ever so slightly, House Manager centers the vertex of the wire angle—and measures from that point to the top of the picture frame: 9″.
She now can make the final mark for Handy Man. She climbs the ladder for the third time and measures 9″ from the mark she made earlier. Again, being very careful, she makes a tiny mark on the wall.
House Manager’s work is done. If anything goes wrong now, it’s Handy Man’s fault.
She folds up the ladder and gathers her supplies. Then she’s off to order beef cupcakes for Mr. Cuddles’s party.
In my interview with painter, Samantha Hand, she mentioned something called the Rule of Thirds. I’ve heard of this, but I honestly had no idea what it was about.
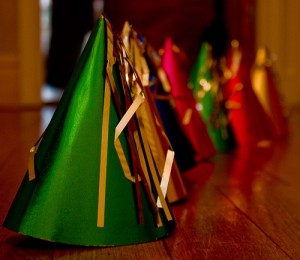
Turns out the Rule of Thirds isn’t really about thirds, per se. Instead it’s about ninths. The idea is to divide the image into nine equal parts — something like this (Photo Credit: Lachlan via Compfightcc):
There are a couple of things to notice here. First there are exactly nine rectangles inside the one rectangle — forming a 3 x 3 grid. Second, all of the smaller rectangles are congruent, which just means they are the same size and shape. Last, each of the smaller rectangles is proportional to the larger rectangle.
What does this proportional thing mean? It’s simple, but let me explain using some numbers. Let’s say that the photo to the left measures 12 in by 6 in. (It probably doesn’t but stay with me.) From that information, we can determine the dimensions of the smaller rectangles: 12 in ÷ 3 = 4 in and 6 in ÷ 3 = 2 in. So each of the smaller rectangles is 4 in by 2 in.
If the small and large rectangles are proportional, they’ll have the same ratio. Let’s take a look:
12/6 = 2
4/2 = 2
This ratio that they have in common has a fancy name: the scale factor. (And if you know anything about drafting or making scale models, that will be familiar.)
Now before we get too far into this, let me say that Samantha — and most painters and photographers who might use the Rule of Thirds — isn’t thinking about proportion and scale factor. But this a good example of when proportions are important andintuitive.
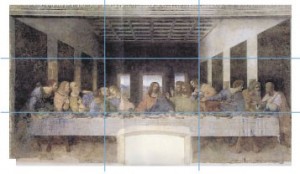
So getting back to the Rule of Thirds — according to some research, people’s eyes are naturally drawn to where the grid lines intersect. A painter can use this information to draw viewers into the painting, especially if there are surprising elements or those that should have more emphasis. Take a look at Da Vinci’s The Last Supper.
Image courtesy of Atelier Mends
Notice how the table itself sits along the bottom horizontal line. The left vertical line crosses Judas, Peter and John, and the right vertical line crosses Thomas, James and Philip. Interestingly, the greatest tension in the piece is at these two points, while Jesus occupies the exact center of the painting with a calm demeanor. Whatever your religious beliefs are, the story this painting tells is furthered by Da Vinci’s use of the Rule of Thirds.
In a couple of weeks, you’ll meet a photographer who probably also uses the Rule of Thirds in her work. In the meantime, see if you can superimpose an imaginary 3 by 3 grid over your favorite paintings or photographs. How does the Rule of Thirds draw you into the piece? How does it help you notice important or surprising details?
Have you noticed the Rule of Thirds in paintings that you love? Share your thoughts in the comments section!
Sam doesn’t remember this, but when she and I were in middle school, I used to ride home with her on the bus after school, when we’d watch Godzilla on television and eat her mother’s homemade potato bread. At that time, she said she wanted to be a veterinarian (like her dad). Instead she earned a BA in art and then her MFA. Since 2010, she’s discovered her talent in oil painting.
Samantha Hand has some mad skills when it comes to oils and canvas. And even I was surprised by the math that she uses. Unlike most of the other folks I’ve interviewed for Math at Work Monday features, Sam really counts on being able to visualize the math she needs. Read on…
Can you explain what you do for a living? For the last two years, I have completely immersed myself in oil painting and have tackled landscape, plein air, still life and portraiture. Currently I am painting compositions that intrigue me in hopes of selling them, while accepting commissions on a variety of subjects. Recent projects include still life and figurative painting.
When do you use basic math in your job? I use the most math at the beginning stages of a painting. When I am sketching thumbnail ideas, I use the rule of thirds to compose a more interesting picture. I use a variety of angles to draw the eye toward the focus of the picture and to lead the eye around the composition. I also use angles in drawing perspective when I am attempting to create depth in a two-dimensional space. (For example, the angle of a building is wider in the foreground and will go toward a vanishing point as the building retreats into the distance)
If the composition is complex, as in a triple portraitI am currently working on, I use a grid to enlarge smaller reference images to the larger size of the canvas. This helps to keep the proportions of the sketch on the canvas accurate. Proportions are also important in balancing the values and subject matter in a composition. I check to see if the proportion of dark values is greater or lesser than the proportion of light values to add interest. I may balance the visual weight of the subject with a greater space of sky to create visual tension or to draw the eye toward the subject.
Mr. Allison’s Hat
When I am sketching the figure I am constantly checking my proportions by comparing the size of body parts. For example, in most faces the space between the eyes is the width of one of the eyes in the face. Also, in general, people are approximately 6 and a half heads tall. I use a paint brush or pencil to measure and compare. I also use this measuring and comparing in all other subject compositions to check my spacing and proportions.
Once I begin painting, I use ratios in the mixing of colors. If I am looking for a purple I may mix an equal amount of red and blue. But if I want a warmer purple with a reddish tint I’ll use less blue in the mixture. Throwing in the amount of yellow equal to the red will turn it toward a brown. Equal measures of red, blue, yellow becomes a neutral gray. There are infinite numbers of colors to be mixed which is one of the most exciting things about painting.
Do you use any technology to help with this math? I do not use a calculator or computer because the math I use is simple and not very exact. It is more about the feeling of balance or rightness. If something doesn’t feel right with the composition I begin to check using more exact measurements and angles.
How do you think math helps you do your job better? Math is the building block of my compositions. I use angles and proportions to try and create intriguing compositions with believable subject matter.
No. 5 tiara
How comfortable with math do you feel? I am very comfortable with the math I use in my artwork but less so with the everyday math of a household. Somehow I feel as if I can visual the math I use in compositions and it makes sense to me. When I apply it to household tasks I have to really focus on the task at hand.
What kind of math did you take in high school? I only vaguely remember my classes in high school but did take math analysis, geometry and the other algebra courses offered. I really enjoyed my math classes and felt confident in my ability, though less so with geometry. I continued with a calculus course in the first year of college and enjoyed that also. Unfortunately, I think I’ve only retained very simple math skills.
Did you have to learn new skills in order to do the math you use in your job? I haven’t had to learn any new skills yet but I have learned to use the math I know in tangible situations.
Did you have any idea about the math that goes into planning a painting? If you have a question for Samantha, ask it in the comments section.
This month, Math for Grownups has gone arty, taking a close look at how math shows up in the visual arts. Last week, glass blowing took center stage.
Since interviewing Elizabeth Perkins for Math at Work Monday, I have been obsessed with the process of glass blowing. I’ve watched videos and read about the step-by-step process. I still don’t know much — this stuff is complicated! — but there are a few little math connections that I made here and there, and I thought I’d share them with you.
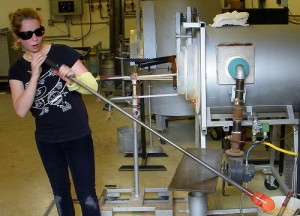
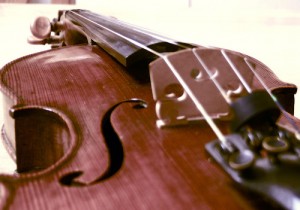
First off, there are the tools. The steel pipe that holds the glass is a very long cylinder or straw. The hole allows the artist to blow air into the glass at one end, which creates the bubble.
Photo courtesy of runneralan2004.
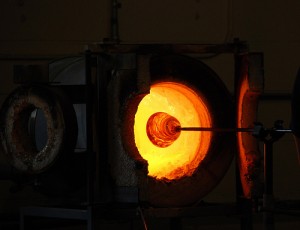
Then there are not one, not two, but three furnaces. Why three? Because the entire process requires different levels of heat. The first furnace contains molten glass. The second, called the “glory hole” is used to reheat the piece as it’s being formed. And the third, which is called the “lehr” or “annealer” is used to cool the piece very slowly and deliberately so it maintains structural soundness.
This is the furnace called the “glory hole.” (Photo courtesy of Brian Hillegas.)
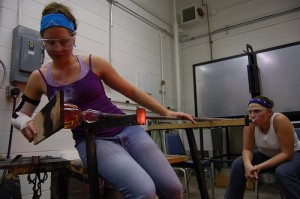
The artist is constantly working against temperature changes. When the glass is in liquid or semi-solid state, its shape can be changed, and this is accomplished by spinning the pipe. To achieve a symmetric shape, the glass must be spun in consistent circles. This is where the bench comes in. The glass blower can place the pipe along two parallel arms and push the pipe out and in. Because the arms are parallel and the same height from the floor, the glass can be spun consistently.
There’s a lot happening in this picture, but notice that the two arms of the bench are parallel and equidistant from the floor. That keeps the pipe parallel to the floor and the glass spinning in a symmetrical, consistent shape. (Photo courtesy of focal1x.)
Okay, so we have some geometry (the pipe and the bench) and measurement (the furnaces regulated at different temperatures).
Time for more geometry. After the glass blower gathers a layer of glass on the end of her pipe from the first furnace, she rolls it on a table to give it a cylindrical shape. Blowing into the pipe creates the bubble — which eventually will become the curve of a bowl, glass, lampshade or something altogether different. How that bubble is formed is critical to the stability of the piece. The glass must be thicker around the bottom and thinner along the sides.
And this is where things get really mathy. See, the bubble at the end of a glass blower’s pipe is usually some kind of ellipsoid. You already know what an ellipsoid is. You live on one: planet Earth. An ellipsoid is like a slightly flattened sphere. In fact, a sphere is a special kind of an ellipsoid.
After the glass blower completes the piece, it goes into the annealer, which is programmed for that particular piece of glass. Some pieces need to cool more slowly than others, and that cooling process is dictated by math.
So there you have it — my very uneducated look at the math of glass blowing. You too can see math in everything, if you just look closely enough.
Are you noticing math in art? Share your observations in the comments section.
On Monday, I introduced you to Elizabeth Perkins, an up-and-coming glass artist in Seattle. (She also happens to be one of my former students, but that is mere coincidence. I take no credit whatsoever for her success and talent.) In her interview, she mentioned that she depends on the Fibonacci sequence to develop some of her annealing programs, or processes for cooling the glass so that is remains structurally sound.
But what the heck is a Fibonacci sequence?
Well, it’s a pretty cool list of numbers. And it’s also really, really easy to figure out. See for yourself:
0, 1, 1, 2, 3, 5, 8, 13, 21, ?
What’s the next number?
I’ll give you a chance to think about it.
Need a hint? Pick any number in the list (except for the first 0 and first 1), and look at the two numbers before it.
Get it yet? (The correct answer is 34.)
The Fibonacci sequence is generated by adding the last two numbers together to get the next number. Take a look:
0 + 1 = 1
1 + 1 = 2
1 + 2 = 3
2 + 3 = 5
3 + 5 = 8
5 + 8 = 13
8 + 13 = 21
13 + 21 = 34
Now that you know this rule, you could conceivably add numbers to this sequence until you got bored or exhausted (which ever comes first).
The fellow who discovered this sequence was, you guessed it, Fibonacci — an Italian mathematician and philosopher who was reportedly born in 1175 AD. But to be honest, his sequence is not the greatest contribution Fibonacci (or Leonardo de Pisa) gave to humankind. In fact, he is the father of our decimal system. Yep, the fact that you can count the $5.23 you have in your wallet is due to a guy whose real name we don’t even know for sure.
But I digress.
The Fibonacci sequence isn’t just an easy and cool math fact. It’s cool — and really, really important — because it shows up everywhere. Here are just a few examples:
If you count the petals of various species of daisies, you’ll get one of the Fibonacci numbers.
The length of the bones in your wrist and hand are a Fibonacci sequence.
The spiral of a pineapple is arranged in Fibonacci numbers.
Branches of a tree grow in a Fibonacci sequence (one branch, two branches, three branches, five branches, and so on, moving up the height of the tree).
The gender of bees in reproduction mirrors the Fibonacci sequence.
Photo courtesy of Mr. Velocipede
And then there’s art. Art loves the Fibonacci sequence. Since the Greeks formalized what is beautiful in architecture and paintings, this little list of numbers has been front and center in a variety of artistic fields.
For example, this seven plate print is gorgeous and also represents something called the golden spiral. The sides of each square (starting in the center with the smallest squares) correlate to the numbers in the Fibonacci sequence. So, the smallest square has side length of 1 unit, the next largest is 2 units, the next is 3 units, the next is 5 units, etc.
Cool huh?
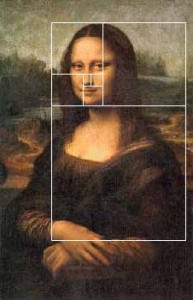
It gets better. Remember the lady with the mysterious smile? Leonardo da Vinci was fascinated by mathematics, and some folks have noticed that his lovely lady’s facial characteristics follow the path of the Fibonacci sequence.
Image courtesy of www.shoshone.k12.id.us
Do you see how the squares line up with the base of her eyes and bottom of her chin, and surround her nose perfectly?
So there you have it. What we see as beautiful could very well be because of mathematical wonders like Fibonacci’s sequence. And as Beth the glass blower shows, this magical little list of numbers is useful in the science of making art as well.
Earlier this year, I posted a really, really cool video about the Fibonacci sequence in nature. Check it out here.Save
Elizabeth Perkins with “The Miller’s Lie/I Love America”
I’ve known Elizabeth Perkins since she was about 16 years old, I think. In fact, I’ve always called her Beth.
I was Beth’s geometry teacher way back when. And I was so excited to find out that she’s now a very successful glass artist. After graduating from Atlanta College of Art in 1997 with a degree in sculpture, she embarked upon an amazing journey as an artist and teacher. She earned her MFA from Virginia Commonwealth University in 2004.
Like me, Beth grew up in a rural, southern town and has a very strong connection to her family, so I’m really moved by her work, which incorporates glass, found objects and heirlooms. But you know what I’m going to say next: The fact that Beth uses math in her art is both surprising and expected. Read on to learn more.
Can you explain what you do for a living? I work as a production glass blower for a company called Glassybaby and in addition serve as a contractual glass blowing and artist assistant to other professional artist here in Seattle. I also continue to make my own sculpture primarily in glass and am able to teach workshops in my specific area of expertise at Pratt Fine Arts Center.
“Glass Lace Mural” (100% cast glass: pate de verre)
When do you use basic math in your job? I use math all the time in my job. One of the primary areas is in creating and writing annealing programs. This is the process where glass is cooled slowly so that it can cool evenly from the outside to the inside. This differs depending on a glass’ annealing temperature, the thickness of the glass, size, and the thickness of the mold material (if you are casting glass). The annealing programs are structured on the Fibonacci sequence, an integer sequence.
Do you use any technology to help with this math? I usually do the math by hand, because I really have the need to visualize everything that I do. The math result (which is usually in diminishing time increments per hour) is then called the annealing program for your glass project, which for me as an artist changes with most every piece — because I rarely repeat any image. The annealing program is then put in to a controller. The controller works on a relay to turn on and turn off the electricity in the heating elements inside an annealer or kiln. Some controllers are set up to combine the time per hour cumulatively and some are not. So I sometimes adjust the type of program based on the controller I am using. All of my mold materials, as well as glass, are measured when creating castings, so that the ratios are correct. This insures that the “investment” (mold body) is as strong as it can be, to hold up to temperatures up to 1600 degrees. Measuring the glass is also important so that the mold is completely filled but not overfilled. (If a mold overflows, that can ruin the kiln.)
How do you think math helps you do your job better? Without math, I would be very wasteful with time and resources. Math helps to create little science experiments in my daily artistic practice, as well as a strong control for testing firings and materials to get the best outcome in my work. When I am working on a project, I keep detailed notes of all of my recipes for investment bodies and glass and the temperature that each glass moves. Because all glasses and all colors of glass have a different material composition and they move at different rates and temperatures. The firing and annealing schedules also are included variables in these experiments. These are all the things I deal with on a daily bases that have everything and nothing to do with the image I am trying to convey in glass. Every sculpture includes created and solved math problems.
How comfortable with math do you feel? I have always, well, just not been very strong in math. I use it everyday though. I am one of those people that feels comfortable with patterns and shapes. So perhaps I am more comfortable managing things like the Fibonacci sequence as well as geometry in my art practice problems. I find now that my measuring has come so routine that I can feel the investment body when it is wet and know if the ratios are right and kind of fudge it with smaller sculptures. With larger sculptures I can’t take those shortcuts. I often use the old woodworker’s rule of measuring twice and cutting once. I always check and re-check my math.
What kind of math did you take in high school? I took the required math but no advanced math courses. I liked geometry, but I never felt like I was ever good at math or liked it. But I think for this reason I have a deep satisfaction when I am able to figure out these strange solutions to artistic problems. I once became obsessed with figuring out the physics involved in the weight differential of glass on the end of a glass pipe. (Glass pipes have a standard length but the material amount varies depending on what you are making, and it is constantly changing form while you are making it.)
Did you have to learn new skills in order to do the math you use in your job? Yes. I had to build on very basic math skill sets, only because I was unable to comprehend much of math. I do think because math is necessary for what i do I am even more motivated and eager to find solutions.
I am a skilled, talented, and a creative artist, I feel very good about that and very proud. I feel very honored that the math teachers I had in high school somehow managed to create “a current between the wires.” But I guess even a pickle can carry current. I use lots of math on a daily basis, and without their lessons I would not be able to make my work at all. While math is not my lover, it’s certainly a confidant. It’s always got my back.
And without Beth, I may not have felt like a great teacher. Have questions for Beth? Feel free to ask them in the comments section.
Last night, my family and I had a real treat. In the midst of an impossibly busy week, we took time out to sit in a darkened theatre and be transported to another land and another time. As the lights dimmed and the orchestra swelled, we were suddenly in 1905 Russia, with Tevye, his wife Golde and their five daughters. The man sitting next to me hummed along with every song, and I mouthed the words. Like much of the rest of the audience, I found myself grinning at Tevys’s dancing–and crying when he declared his daughter, Chava, dead to him.
*sigh*
This morning, the tunes from Fiddler on the Roof are still running through my head. For me, there’s not much more inspiring and beautiful than a staged musical.
One my family’s resolutions this year is to see more theatre. And we’ve made good on that promise already. In January, we saw Arsenic and Old Lace and a community college production ofGreater Tuna. I’m not sure what’s next.
Like many folks, I believe art (of all kinds) provides the gorgeous background to a sometimes drab world. Art makes me think, while invoking emotions that can be otherwise hard to access. I’ve found myself moved by Pyotr Ilyich Tchaikovsky, Martha Graham, Edgar Degas, Mary Oliver, Amy Ray and Oscar Wilde. Art has become a centerpiece of my daily life.
But if you grew up thinking that art and mathematics were mutually exclusive entities, I hope you’ve been disabused of that notion. If not, stay tuned.
Here at Math for Grownups, February is all about art. I’ll introduce you to some amazing artists — like Elizabeth Perkins, one of my former math students, who is now a highly conceptual glass artist. These creative souls will help make the connections between art and math.
And we’ll delve into some of the more esoteric aspects of mathematics that form the underpinnings of natural beauty, classic art and modern music–like symmetry, the golden ratioand Fibonacci’s Sequence.
If art provides the beauty of the world, math describes it. From poetry to glass sculptures to song, math is at the heart of all artistic endeavors. I hope you’ll join me this month as we uncover the beauty of the world around us–with math.
What is your favorite artistic form? Music, paintings, theatre, writing? Share your thoughts about math and art in the comments section below. And if you’ve always had a question about the connections between art and math, ask. I’d love to explore the answer in a post this month.Save
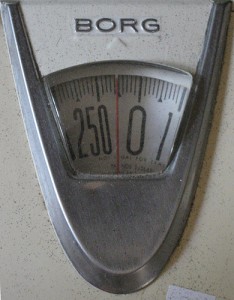
I am not one to talk about my personal weight loss (or gain, usually), especially since I’ve spent years bouncing between feeling good about my figure and avoiding mirrors at all costs.
Fact is, I’ve tried lots and lots of diets — the South Beach Diet, Body for Life, calorie counting, Weight Watchers. I’ve even tried hypnosis and extreme exercise. But even though I have never felt completely successful in these attempts, I haven’t failed. Each time, I’ve refined my goals and figured out things that I will and won’t do.
With all this in mind, I decided in late December that I was going to give Weight Watchers another try. Two things have happened since I was last actively using the program: the PointsPlus program has been refined just a bit, and I wrote a math book. I have to say that thinking about math so much over the last year has been a great benefit in figuring the PointsPlus values for everything I eat.
(In case you have been living under a rock or don’t know who Jennifer Hudson is, the Weight Watchers program is based on a points system. Each person is allotted a certain number of points per day, based on their weight and gender. Everyone also has 49 extra points to eat throughout the week. Foods have points values based on… well, read on, because that’s kind of what I’m getting to in this post.)
My daily PointsPlus allotment is 26. I use online tools to help me track the points of the foods that I’m eating (and the drinks that I’m drinking). And of course, I have those extra 49 points to spread throughout the week.
So first, my math brain figured out that if I use up all 49 points throughout the week (and believe me, I do!), that translates to 7 points per day. If I only eat an extra 5 points one day, I have an extra 9 points on another day. (The 49 points carry over, but if I don’t eat all 29 points in a day, poof! they’re gone.)
Believe me, I’ve gotten damn good at these little calculations. An extra 2 points is the difference between a light and a regular beer.
But it’s the points values themselves that are so amazing, mathematically speaking. Weight Watchers has done some pretty tricky math to make it easier for us to figure out what to eat. Instead of counting just calories, we’re considering four components of our food: protein, fiber, carbohydrates and fat. These values are run through a formula that outputs a handy-dandy PointsPlus value. (Online tools and special calculators find PointsPlus values for any foods, and common values are listed in a variety of Weight Watchers resources.)
This formula is pretty complex. I’ve seen versions of it online, and apparently it is written in black and white in Weight Watcher’s patent. But I don’t need to have the details to know some pretty simple things:
1. Four of the formula’s variables are the amount of protein, fiber, carbohydrates and fat in the food.
2. The answer is likely rounded, since PointsPlus values are all whole numbers.
That last one is pretty important. It means that 0 points isn’t necessarily 0 points.
You see, almost all veggies and fruits count as 0 points — a big change in the program. This makes perfect sense, because we should all be eating more fruits and veggies, not deciding between a banana and a low-calorie fruit bar that was made in a factory far, far away.
But fruits and veggies have calories and sugars. That means an apple may actually have 0.2 points (or something like that). So while one apple may be 0 points, 7 apples probably aren’t. In other words, this is a case of 0 + 0 ≠ 0.
If you’re among the thousands of folks who joined Weight Watchers this month, count math among the skills that will help you lose weight — whether you’re counting your points or trying to make sense of how it all works!
Are you a Weight Watchers member? How have you used math to help you stay on track? Or if you’ve managed your diet in other ways, how has math helped? Respond in the comments section.
January 2012 seems extra long! In fact, there are five — count ’em, five — Mondays in this month. And while I’ve never missed a Math at Work Monday, I decided to take a break this week. (Want to read up on previous Q&As for this month? Check them out: Robert the exercise physiologist, Janine the professional organizer, Jameel the budget counselor and Kiki the career coach.)
This month has been all about New Year’s Resolutions: getting in shape and getting organized, boning up on budget basics and becoming your own boss. But what are our chances of actually succeeding in any (or all) of these things? Once again, I ask you: let’s look at the math.
According to a 2008 survey conducted by author and motivational speaker, Steven Shapiro and the Opinion Research Group (Princeton, NJ), 45 percent of Americans set New Year’s Resolutions, but only 8 percent of these reach their goals each year and 24 percent say they never keep their resolutions.
(Disclaimer: I really can’t vouch for the veracity of this study, because I can’t find the data. But let’s go with it, just to prove my point. The numbers aren’t really all that important.)
How many of you read those statistics and thought: “Well, there’s no point in even making resolutions! With chances like those, I’m doomed to fail!”
Here’s the good news: If you nodded your head, you are not alone. And here’s the better news: Statistics don’t work that way.
It’s easy to look at stats and think that they must be true and must apply to everyone in every situation. Cold, hard numbers don’t lie, right? Maybe the numbers don’t lie, but it sure is tempting to use those numbers to describe something that isn’t true. (Politicians do it all the time.)
There are a couple of ways to describe this particular fallacy. But I think one of most important is to consider what is known as independent events. See, each person who sets a New Year’s Resolution is independent of all of the other people who do the same thing. (Even if you’re all making the same resolutions.)
And it gets even trickier. Each year that you set a resolution is independent, and each resolution that you set is also — you guessed it — independent.
In other words, your success probably doesn’t have much of anything to do with how well others have followed through on their yearly goals — or even how well you’ve done in years past. (I say probably, because you may be one of those folks who is easily influenced by statistics. In other words, you may decide that you cannot succeed in meeting your resolutions, simply because you read somewhere that most people don’t.)
There’s tons of research out there on why people make resolutions and how they can be successful in them. If you looked at this research and determined that you have many of the same obstacles, maybe — just maybe — you could predict your chance of success.
But simply because many other people aren’t successful doesn’t mean you are automatically doomed to fail. Independence is only one reason for this. Randomness is another.
Dice are random, but people aren’t. (In fact, I saw a great video that demonstrates this last week. Of course I can’t put my hands on it now, but I’ll post a link, if I do.) While a (fair) die only has to worry about gravity, we have many more things that influence our behavior, decisions and more. That doesn’t mean that people aren’t more likely to act a certain way under certain conditions. But it certainly does mean that your New Year’s resolutions are not beholden to statistics.
So, the next time you read an article about the low rate of success with New Year’s Resolutions, remember this: You certainly can succeed — even if you failed last year. And if you are philosophically opposed to New Year’s resolutions, you’ll need a better reason than most people don’t keep them.
How are you doing with your New Year’s Resolutions? Share in the comments section. And come back on Wednesday — I’ll reveal how things are going with me!Save
Every day, around the world, countless mothers (and quite a few fathers) are considering the same question: Now that my kids are older, is it time to go back to work? The U.S. Census reported that there were 5 million stay-at-home mothers in 2010. And the decision to forgo paid employment in favor of days filled with finger paint, potty-training and Mommy-And-Me playgroups is certainly rife with emotion and even debate.
It’s also very personal, and not just because these choices reflect our unique sets of values. The decision to be a stay-at-home parent — or to return to work — is a financial one.
Let’s face it, if the family needs the money, going back to work sure beats sharing a one-bedroom apartment with three kids, a dog and a snoring partner. Right? But the math has to work out.
That’s because for many parents, returning to work means paying for childcare — and anyone who has done this knows it usually ain’t cheap. The good news is that the math involved is pretty simple. You just need to take a little time to work it out.
Jackie has three gorgeous kids, all under the age of 6 years old. As the economy has worsened, her husband’s salary just isn’t going as far as it used to, and besides, she’d like to get back to her career as a pediatric nurse. The doctor she once worked for called to see if she’d be interested in a part-time position at his practice.
Financially speaking, is this a good idea? Let’s look at the numbers.
If she takes this position, she can earn $210 per day, after taxes, and she would be expected to work three days a week. The practice doesn’t offer health insurance for part-time workers, but the family is on Jackie’s husband’s plan, so that’s a non-issue. Other benefits are minimal, as there are no sick or vacation days and no retirement fund. (She can switch schedules with another part-time nurse to cover any days she needs off.)
How much can she expect to earn each week?
$210 x 3 days = $630
Jackie can’t bring her kids to work with her or let them fend for themselves. Nope, she’s got to think about laying out some cash for childcare, and like most folks, Jackie has a somewhat complex situation to consider. Her oldest is in half-day Kindergarten, so she only needs part-time care for her. But her three-year-old twins need to be looked after all day. While her mom would love to watch the kids, the eight-hour commute to her house just isn’t practical.
Calling on friends and neighbors, Jackie considers her options. Pretty quickly, her decision becomes clear. Luckily, there’s a daycare center just around the corner from her daughter’s elementary school. Even better, it offers part-time care. And just down the street from Jackie’s house lives a woman who offers in-home care. She places a few calls and learns that each place has openings.
Still, she needs to crunch the numbers. The daycare center charges $50 per day, for part-time care. The in-home caregiver charges $175 per week, per child. How much of a hit will Jackie take in her take-home pay?
First, she needs to find the cost per week for her older daughter:
$50 x 3 days = $150
Next, she needs to find the weekly cost for her younger children:
$175 x 2 = $350
Finally, she adds the two together:
$150 + $350 = $500
So she can reasonably expect to pay $500 per week in childcare. That means she’ll be taking home $130 each week.
$630 – $500 = $130
Yikes! What looked like a great part-time salary is now looking pretty skimpy. But there are two more calculations Jackie considers before freaking out: Her monthly and yearly take-home after childcare costs.
$130 x 4 weeks = $520 per month
$130 per week x 50 weeks = $6,500
These numbers tell her that she can contribute more than $500 each month to the mortgage payment. Or if her husband gets that promotion he’s looking at, they could put almost $7,000 towards their savings.
There are also other financial benefits to consider. For example, if Jackie keeps one foot in her career, she can get up to speed (and stay ahead of) changes in her field. And if she’s already employed at the doctor’s office, she may be better positioned for a full-time job once the kids are all in school.
Now Jackie only has to deal with the emotional decisions — which are pretty tough. But with these figures, she can at least say for sure how her family’s budget will benefit in the short run.
All you parents, what went into your decision to get back in the work force or stay at home? Did you do the math to figure out if it was financially worth it? Or did the numbers show that staying at home was much more financially viable? Share your stories in the comments section.Save
Deciding to leave a steady job with a steady income is a big step. Leaving in favor of working for yourself might seem like the craziest idea of all. Believe me. I know from experience.
I’ve been a freelance writer for going on 11 years now, about half of that time while holding down a part- or full-time job. But when my family decided to move to Maryland, I figured it was a good time to try freelancing “without a net.” I didn’t have a job yet, but I did have a Rolodex full of great editorial contacts and a good understanding of how to build a freelance career.
Over the last six years, I’ve grown my business in many ways: from part-time to full-time, from focusing on journalism to writing a book and shifting my attention to curriculum development. (I did the latter, when the bottom fell out of the magazine industry a few years ago.)
I can say two things about this experience: Math definitely helped me launch and sustain my new career. And I couldn’t have made the leap without the support and advice of writer extraordinaire and all-around generous gal, Linda Formichelli.
I met Linda when we were both starting out, but she was about a year ahead of me in the process. These days, Linda is an accomplished writer with two books (The Renegade Writer and Query Letters that Rock), bylines from countless top-notch publications and a booming coaching business.
One thing that any experienced and successful freelance writer knows is this: The writing is secondary. Sure, I’m in it to write. But without some really good business skills, no one will hire me to do what I love. In other words, we’re business owners first and writers second. (And this is true for almost anyone who runs their own business.)
Unlike me, Linda doesn’t have a degree in mathematics. (Her Master’s from Berkley UC is in Slavic Languages.) Doesn’t matter. Linda has learned to apply math to her freelance business. First up: dealing with the bottom line.
“I needed to figure out my hourly copywriting rate based on how much I needed total to make a living plus the amount I needed for overhead — equipment, office supplies, etc.,” Linda says. “I divided that by the number of billable hours I predicted I would have in a year, and also had to keep in mind the going rates — what the market would bear.”
So no, Linda was not consumed with the kinds of pens she would use or scribbling by candlelight each night. The practical won over the romantic. Even with magazines.
“Magazines usually pay by the word, and I needed to figure out how that translated to an hourly rate,” she says. “For example, I sometimes make more money per hour writing for 50 cents per word versus $2 per word because the $2 per word articles are much more research-intensive and often required multiple rewrites.”
(I can’t tell you how important her last sentence is. If a publication requires many hours of editing and rewrites — and some do — your hourly rate plummets. This is part of what we freelancers call the PIA factor.)
Knowing how quickly she can write also helps establishing whether or not an assignment makes sense.
“I know that I can write about 800 words an hour (after the research and interviews are completed), so I can figure out how much time it will take me to write an article of any length,” she says. “For example, many articles run at around 1,500 words, so this will take me about two hours.”
Depending on what the client is offering, this may or may not be a good deal. Here’s an example:
You’ve been offered a 1,500-word story assignment for your local alt weekly newspaper. They’re willing to pay you $0.35 per word, and you’ll need to do four phone interviews. You estimate that those interviews will take about an hour each, and you think you can write the story in two hours. You’ve worked with them before, so you know you can count on about 1 hour of editing. Is the assignment worth it? Let’s look at the math.
So you can expect to spend about 6 hours on the story in all. (Notice, though, that there’s no time allotted for research or back-and-forth with the editor. And you haven’t included any of the time you spent convincing the editor to give you the assignment.)
$525 ÷ 7 hours = $75 per hour
Now, maybe that’s a good rate for you and maybe it’s not. Regardless, you now have a solid idea of whether or not you should take the assignment.
(If you’re not self-employed, you may be surprised by this rate. But remember we self-employed folks are responsible for all overhead — equipment, facilities, health insurance, vacation and sick leave, taxes and retirement savings.)
And this works in all sorts of careers, whether you’re an artisan or have a landscaping business. The math takes the guesswork out of business planning. And it can keep you on track in any new business venture that comes your way.
If you are attending the American Society for Journalists and Authors(ASJA) conference in New York in April, be sure to check out my panel on math and writing. I and two panelists will talk about how math is important in reporting and running a freelance business. I promise it won’t be boring — and you’ll probably learn how to be a better reporter and business owner. (Psst: Gretchen Rubin, author of The Happiness Project is the luncheon speaker!)
Hey freelancers (of all kinds): what’s your favorite math tip for running your business? Share it in the comments section.


