Tag

JOURNALISM

Browsing

I put this little smiley face here, so you’ll feel comfortable. And you do, right? Because if you’re a writer, you might not really want to think about math so much. And statistics? Yuck!

At least that’s how I once felt. Stats and I have never been great friends, but the more I learn about it, the more I like the subject. Really.

And that’s a really good thing, since much of my writing requires statistics.

No, I didn’t say sometimes uses or is strongly suggested. I said requires. And I meant it.

The reasons are pretty darned obvious, really. In fact there are three really good ones.

Good Stats Inspire Trust

When you add the right numbers to a story in the right ways, your readers will come right along with you. Readers don’t want to be overwhelmed with numbers, but well-placed figures will help your reader believe what you’re saying.

It’s not enough to say, for example, that incomes have risen in a particular geographic area. How do you know that? And if a source told you so, how can you confirm that information?

Of course, if your readers can’t trust the statistic, they can’t trust you either. It’s critical to learn how to judge data, how to assess if the numbers make sense. You’ve also got to learn how to sprinkle in the data without losing readers. (There’s an entire chapter in my book, Math for Writers, that shows you how.)

Good Stats Keep Your Story Honest

So many times, the story I end up with is not the story I expected. Here’s an example: when I set out to write about methamphetamine use in Maryland for my local alt-weekly, I never expected to find out what I did. Compared to West Virginia, Virginia and Pennsylvania, my state had shockingly low meth numbers. I looked at the information three ways to Sunday, and I came up with the same conclusion: Maryland did not have a meth problem.

If I hadn’t looked at the stats, I might have written a very different story. I could have focused on the very few meth lab busts in Maryland, painting the all-to-common and vivid picture of destruction and death. I could have interviewed a handful of gay men who were tweaking on the stimulant regularly.

Instead, I compared the number of meth lab busts, treatment centers, injuries and deaths to those in surrounding states and found the totals to be much, much lower. It was such an astonishing difference, I realized pretty quickly that I had a very different story on my hands. (And boy was that a blast to report and write!)

Even if you think you know the stats, get them and look at them carefully. Do careful comparisons with like numbers. That little bit of effort and thought will keep you honest.

By the way, stats keep editors honest, too. Many times, we writers are assigned stories by editors who think they know what the angle will be. I’ve had to prove to several editors that their assumptions are off base. Numbers help.

Good Stats Help You Land Great Stories

There are editors out there looking for writers who don’t run in the other direction when math enters the story. After turning in a numbers-heavy story to a national publication a few weeks ago, I asked the editor for more assignments like it. She was so happy to hear that I was willing to tackle stories that relied on statistics for the reporting. Her stable of writers is pretty darned thin when it comes to writers like me. That works in my benefit.

And if you can be the writer who finds a new angle on an old story, thanks to stats, you’ll be a hero to many editors. Digging into the numbers a little more than other writers can help you uncover a gem or two. Don’t take the press release at face value. Figure out if there’s more to the public relations pitch. Call up the researcher. Google the topic and make some comparisons. Then include those hard numbers in your query. Editors love that stuff.

Whether you love math or hate it, if you’re a non-fiction writer, you will use statistics. You might as well get a better handle on those numbers and what they really mean. Then you’re free to do what you really want to do: write.

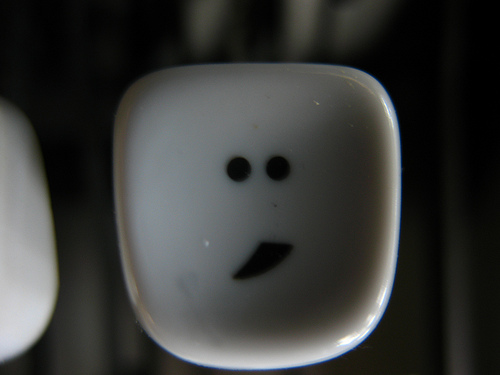
Photo credit: mpclemens via Compfight cc

Yeah, yeah. I get it. You became a writer because you didn’t want to do math. You got into editing a general interest magazine, because you wouldn’t be required to remember the difference between mean and median. Or you decided to write novels, thanks to a horrific experience in your Math for English Majors class.

Only science writers need math, right?

So yeah, science writers are most likely going to geek out on statistical analysis or a super-cool line graph. But lots of us writers need math to help us rise to the tops of our fields. It’s no secret that I believe this. I wrote a book about it. 

In fact, for some writers — like business or health reporters — math is a pretty important skill. But even fiction writers can use a dose of math now and then. Let me break it down for you.

Business Writers

If your beat is businesses, you are probably pretty comfortable with the math that companies use to assess their financial health. This means understanding a little bit about percentages and statistical analysis. You know how to read an annual report, including the charts and graphs that illustrate what the company is trying to say.

At the same time, you probably have a healthy dose of skepticism, You know that statistics can be misleading. To really analyze a company’s status, you need to crunch the numbers yourself. Or at least question where they came from.

Health Writers

It seems that most health stories in magazines and newspapers hinge on a recent study or report. It’s clear when the writer and editor get the math behind that research — and when they don’t. If you’re a health writer, you know how to use those numbers so that your readers are not misled.

This means understanding something about sample size, or when a study’s sample is too small or just right. You also know to ask for the study itself, instead of depending only on the summary or (worse) a press release written by a PR person who doesn’t have a background in that field.

Book Authors

Whether you ghostwrite or pen books using your own name, a little bit of math can go a long way to being sure that you’re on the road to an actual book and making a little money. Even fiction writers can use math in this way.

You use formulas in a spreadsheet to help count down your words and stay on deadline. You use statistical analysis to demonstrate to a potential publisher or agent that people want to read your book. Your platform is not only based on the number of Twitter followers you have, but also how well your fans engage with you on social media.

So even if you were promised no math in your chosen career as a writer, a little bit of math can help. Thankfully, you won’t need a math degree or even a college statistics refresher to master these computations. Clearly you’re smart enough. You’re a writer!

Photo Credit: Toncu via Compfight cc

Need to brush up on your math skills? Check out my book, Math for Writers: Tell a Better Story, Get Published and Make More Money. And be on the lookout for my upcoming online statistics course for writers and journalists. In the meantime, if you have any questions, ask them in the comments section!

Whether the story originates from a study or a few well placed numbers would help drive home a salient point, math is as much a part of modern journalism as a catchy lede or the perfect source. But even with great math skills, journalists are in danger of falling into several traps — and unintentionally misleading their readers. Don’t make these mistakes!

Confusing mean and median

In terms of computations, these are really easy ideas. The mean is the the arithmetic or simple average, while median is the middle value in a set of data arranged from least to greatest. But when should you use mean? And when is the median recommended?

The mean is best for data that is really similar or for measurements like grades, weight or height. Because of the way it is calculated, the mean is influenced by outliers — one or two very large or very small values in the data. These outliers skew the mean, misrepresenting the data set.

Using the median eliminates the chance for an outlier to skew the data. That’s because the extremes are left exactly where they should be — at the extremes. For that reason, medians are often used for dollar values, like home prices or salaries.

Drawing conclusions not explicitly stated in a study

We’ve all seen those stories — coffee will kill you one day and save your life the next. These whiplash-inducing moments may not be the fault of bad research. Instead a reporter or editor could be connecting research results to outcomes that are not revealed at all.

Drawing conclusions is tricky business that should be left to the pros (statisticians in this case). So while it may be tempting to connect A to B, it’s a good idea to double check what the study results actually say.

Not going to the original source

These days, we writers get story ideas from a variety of sources: press releases, articles, and even social media. But when it comes to data, there’s a lot that can happen between the research and its dissemination.

It’s critical to go directly to the original source, rather than pull numbers and conclusions from third parties (yes, even university press releases). Read the study. Call the organization or researcher making these claims.

Using bad data

This pitfall is related to the previous one. If the numbers are wrong in the press release, you risk perpetuating the mistake.

However, it’s also important to consider the original source. Highly partisan or idealogical organizations are often not the best sources for reliable data. Train yourself to be extra skeptical, even of sources that are considered trustworthy. The integrity of your story depends on your digging a little deeper.

Reporting skewed chart data

Pictures are pretty. And while they may paint thousands of words, that story could well be a fairy tale.

An important part of interpreting charts is to carefully consider if the data is properly shown. Do the pie pieces add up to more than 100 percent? Does the range shown on the vertical axis of a line graph make the data seem flatter than it actually is? Sometimes these mistakes are made innocently. Other times, misleading charts are intentional. It’s your job to check these charts for inaccuracies.

Journalists don’t need to be mathematicians, but we do need to question numbers, just as we would question sources. And mostly, you don’t need fancy computations or deep statistical knowledge. Instead, use your natural curiosity and skepticism to be sure that your numbers don’t lie.

Photo Credit: kohlmann.sascha via Compfight cc

Do you have other potential pitfalls to add? Share in the comments section. Or ask questions about the ones listed here! And if you want more details about the math of writing, pick up a copy of Math for Writers, the only math book that most writers and journalists need. Also, look for my upcoming Statistics for Writers course, being offered online later this fall.