Tag

SPREADSHEETS

Browsing

This is the third post in a series about spreadsheets, called Spreadsheets 101. Click if you missed the first (Spreadsheets are Powerful. Here’s How) or second (How to Use Formulas) post.

Mistakes happen. But boy they can be frustrating, especially if you’re learning something new or not feeling so confident with your skills. In terms of spreadsheets, these mistakes can show up in one of two ways: a value that doesn’t make sense or an error message. In this post, you’ll get the ins and outs of diagnosing and fixing these problems.

Errors in spreadsheets are almost always user-generated. In other words, you can’t blame the developer or your computer or Mercury rising. This is both good and bad news — and the process for identifying and fixing these issues is very similar to working your way out of a vexing math problem. Don’t let that worry you. Instead, think of it this way: you have a great opportunity to deal with two difficulties at once.
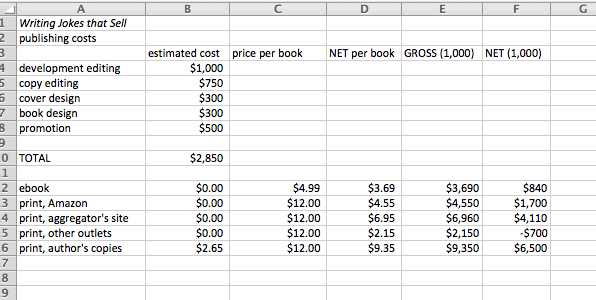
Bad Numbers

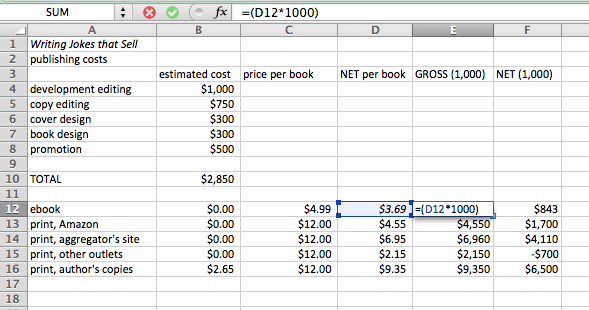
When numbers matter, it’s always a good idea to check everything carefully. This might feel like a real drag, but this little habit can save you time, money and heartache in the long run. Take a look at the spreadsheet below. Can you spot the questionable values?

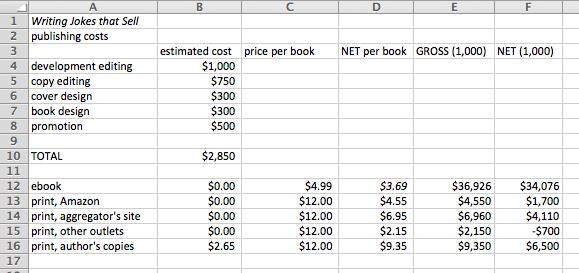
Did you notice the numbers that are out of whack? They’re in E12 and F12: $36,926 and $34,076. It would be awesome to earn that much dough from the sale of 1,000 ebooks, but with a net of $3.69 per book, that doesn’t make any sense at all.

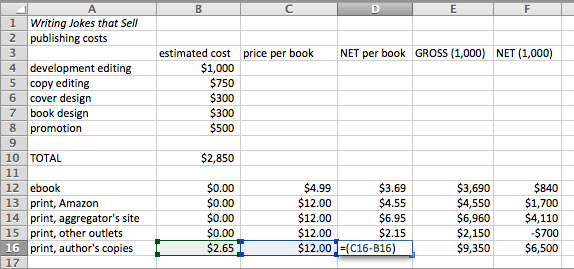
There’s a problem with one of the formulas — probably in E12 or F12. So, let’s take a closer look. If this were your spreadsheet, you could double-click on E12, showing the formula.

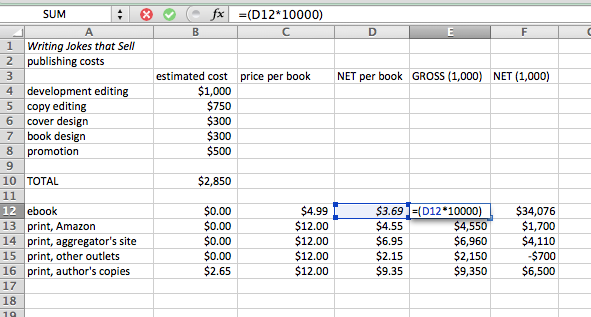
Now, this time, I’ve also included the tool bar over the table itself. Notice that the formula is listed to the right of fx. You can also see it in the cell itself. This formula says that you want to multiply the value in D12 by 10,000. (Count the zeros, if you can’t quite read it.) In other words, this is the net, if you were to sell 10,000 ebooks. But what you’re looking for is the net on 1,000 sales. Ta-da! That’s the problem.

Next, you want to fix the error and see if that solves the problem in F12.

Yep, it did. See what happens there? If you make a mistake in one cell, it can carry to other cells. It pays to be diligent.

In this case, I had simply typed too many zeros. Another easy mistake is referencing the wrong cell (typing C12 instead of D12, which would be a tougher mistake to find). It’s also fairly common to accidentally add a cell name to a formula, by clicking the cell before closing up the formula.

Finally, errors in using the order of operations are really easy to make. If you need to add before multiplying, be sure to put the addition step in parentheses. Otherwise, the computer will follow PEMDAS — multiplying before adding. Take a look:

=((D12+E12)*5) means: Add the values in D12 and E12 and then multiply by 5
=(D12+E12*5) means multiply the value in E12 by 5 and then add the value found in D12

Big difference!

The Formula You Typed Contains an Error

Sometimes your spreadsheet program might give you an error message, like the one below.

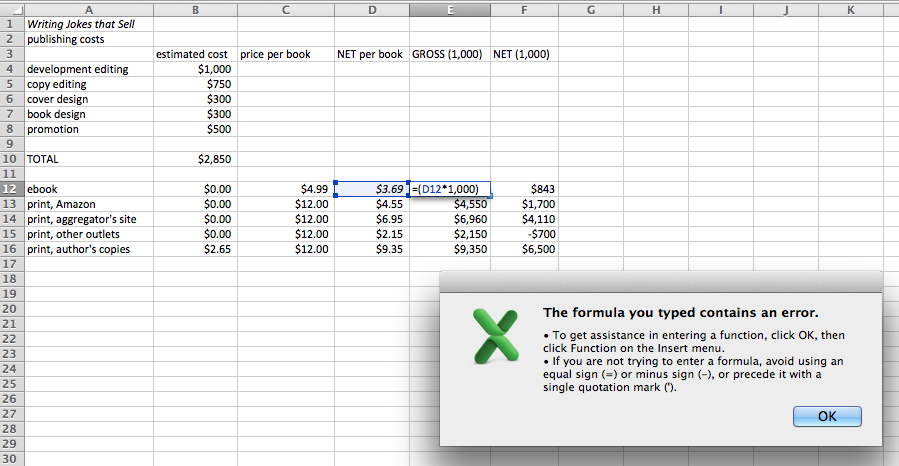
Of course the error message isn’t helpful at all. But look closely at the formula in the cell. Instead of typing “1000”, I’ve typed “1,000”. And that’s a big no-no. Take away that comma separating the 1 from the 0, and all will be right with the world. Other characters you want to avoid include dollar signs ($) and percentage signs (%). Stick to the symbols outlined in the previous post on building formulas.

The key here is not to ever make mistakes but to identify them, if you do. Review all of your formulas before trusting their outcomes. Check that you’ve included the correct cell names, operations and used parentheses where necessary (so that your order of operations is correct. If you get an error message, look for symbols or letters that shouldn’t be in the formulas.

With a little attention to detail, you can be sure that the data generated by formulas is good to go!

What steps do you take to troubleshoot your spreadsheets? Do you have some advice to share or questions you need answers for? Talk to me in the comments section! There’s one more post coming up soon. Later this week, I’ll teach you how to make pretty graphs using spreadsheets. So easy, you won’t believe it!

This post is the first in a writer-centric series, called Spreadsheets 101. In later posts, I look at how to use formulas in spreadsheets, troubleshoot problems and create graphs. 

Want to tell a geek from a non-geek? Ask a simple question: How do you feel about spreadsheets? Geeks will wax poetic about the grace and sensibility of spreadsheets, while non-geeks will either shrug or recoil in horror.

At least that’s my experience.

As a proud geek, I embrace my love of spreadsheets. As a teacher and writer, I know that not everyone is as excited about these technological marvels. Still, while I might fire up Excel for the most mundane tasks — grocery lists or wedding invitation RSVPs, for example — I do think the humble spreadsheet can be quite useful in a variety of more robust and complex settings. This is especially true for freelance writers and other entrepreneurs. We solo artists may not have access to the latest bookkeeping software or even a bookkeeper. We can’t turn to the IT team to help us project revenues for the next year or track the time spent on certain types of projects. (Most of us are the IT team.) That’s where spreadsheets can come in handy.

What Is a Spreadsheet?

A spreadsheet is more powerful than a table, with fewer bells and whistles than a database. The data is arranged in columns and rows. The columns are labeled with capital letters, and the rows are numbered. So each cell can be identified by its unique letter (column) and number (row). For example, A25 or FF102.

All of the data in each row is related somehow. The same goes for the data in each column. That’s how a spreadsheet is like a table. Here’s a picture:

In this example from Math for Writers, a writer is costing out the price of self-publishing. Notice how the columns and rows are related. In every spreadsheet, each cell (one of the little boxes) is related to the headings of the row and column that define that cell. So, $9.35 is the NET per book (column) of print, author’s copies (row) in the spreadsheet above.

But this spreadsheet isn’t just a table. Because of the way it was built, if I change the value in cell B16, the value in D16 will also change. It’s also not a database. That’s because the data cannot be output elsewhere. For example, if I wanted to output this data onto my website — in a simple list, for example — I’d need to use a database. (Examples of databases include the contacts on your smartphone and the movie listings on Netflix. The data — names and phone numbers of contacts or names and ratings of movies — is stored in a database and output on your phone, computer or television set.) Unlike with databases, the data in spreadsheets pretty much stays put.

When Should You Use a Spreadsheet?

Notice that some cells contain text and some cells contain numbers. Spreadsheets are most powerful when the data is numerical. That’s because with a few carefully placed formulas, you can manipulate those numbers — quickly and easily.

For example: in the spreadsheet above, the value $9.35 was not typed into that cell. Surprise! Instead, this values is the result of a formula. Take a look:

When I highlight the $9.35 cell, it changes to show the formula: =(C16-B16). At the same time, cells C16 and B16 are highlighted. This formula is a really simple subtraction problem, but it’s pretty potent. That’s because if I change the value in C16 or B16, the value of D16 changes, too.

This means you don’t have to keep up with a ton of changes. If your formulas are set up correctly, you can simply change the data in other cells as needed, and the formulas keep up with the calculations. For this reason, spreadsheets are really useful in projecting. For example, if the price of the book is changed in the above spreadsheet, you can see how the net and gross values will automatically change. In other words, you can play with the pricing and watch how the total income goes up or down as a result.

Want to make fancy-schmancy graphs? That’s another reason to use a spreadsheet. Once your data is safe and snug inside multiple rows and columns, it can be displayed graphically with the click of a couple keys. Really. It’s that easy. (I’ll show you how in a later post.)

And there you have it. The what and whys of spreadsheets. Stick around. In a day or two, I’ll teach you how to create the all-powerful formula. (It’s not all that magical, and it’s not all that hard either.)

Next up: Learn how to use formulas in spreadsheets and troubleshoot problems.

When have you found spreadsheets most useful? What frustrations have you had with spreadsheets? Share your experiences in the comments section. Also be on the lookout for my next book Math for Writers, which will be available in late January. Yes, writers do use math! I’m so excited to show you how!

The classic answer to the question, “When am I going to use algebra?” is spreadsheets. Now I will admit straight up — I am a spreadsheet junkie. I’ll build one for just about anything, from menu planning to blog schedules to tracking which clients have sent me 1099s. And I know for a fact that this attraction to spreadsheets is not normal. I promise, I will not try to convince you that spreadsheets are the be-all-end-all (though I think they are) or that using a spreadsheet will make your life easier (though it could).

But there’s no denying one important thing: algebra is extremely useful in spreadsheets. And that’s because the power of a spreadsheet is in its ability to crunch numbers for you.

In fact, algebra teachers are using spreadsheets to help students better understand algebra and its real-world uses. Want to see how data is related? Use a spreadsheet to create a line of best fit. Want to find an average quickly? Spreadsheet. Want to know how many children and adults you’ve invited to your wedding? Open up Excel or Numbers or OpenOffice Spreadsheets.

(Yes, we’re back to the wedding. It’s consuming my life right now, so you get to play, too.)

When it came time for me to create the guest list for my wedding — undeniably the most painful part of this entire experience — I naturally reached for good-old Excel. Once I had everyone entered into a spreadsheet, I was able to create a variety of formulas that have helped me manage certain tasks. Here’s an example.

Our reception venue, which also provides the catering, offers a much lower rate for children. They’re getting chicken tenders, rather than the fancy-schmancy meal, so that’s only fair. But there are a lot of kids on our list, and I needed to get a rough estimate of what we would pay. This way, I could make really good decisions about who we could and could not invite. (Told you, this part was really painful.)

Each family, couple or person was listed in one row of the spreadsheet. In two of the columns for each row, I included the number of adults and kids who were invited.

Ann Laing22
Melissa Zach246
Drew Laing22
Graham Laing22

So you can see that my sister, Melissa, has 4 children under 16 years old, while my mother and two brothers don’t have any. But each of their families has 2 adults. The column all the way to the right is the total people in their families who are invited. In fact, I used a very simple formula to find the last column: =SUM(B2:C2). This means, “Take the sum of the values in columns B2 through C2.” The formula allows me to make changes to the values in columns B2 through C2 and automatically update the last column.

But that’s not really where the algebra comes in. At the bottom of my spreadsheet, I use the SUM formula to total the number of kids and the number of adults. Then I use those values to find the cost of the reception food, using a formula I built. Here’s how that worked.

Let’s say I’ve invited 15 kids and 100 adults. I’ve let my spreadsheet automatically find those totals in cells B101 and C101. And let’s say that the cost per adult is $50 and the cost per child is $25. Algebra will help me create a formula based on the cells where this data is found.

=((B101*50)+(C101*25))

Looks ugly, right? Well, that’s because the spreadsheet needs some extra formatting to recognize the formula. But there’s a simpler way to show this:

y = 50a + 25k

In other words the total cost for the food (y) is equal to 50 times the number of adults (a) plus 25 times the number of kids (k). Algebra at work in the real world of wedding planning.

My job today is not to explain the algebra to you step by step. But I did want to demonstrate one really useful — and somewhat common — way that a regular person uses algebra in their regular life. (Okay, so maybe I’m not regular, but hopefully you get my drift.)

Do you use spreadsheets? What formulas have been useful to you in your spreadsheets? Did you think of that as algebra? Why or why not? Share your thoughts in the comments section.