I like math. I even appreciate math. But I can’t say that I love it. Sometimes I get a little thrill in seeing math around me. Mostly, I just feel comfortable with the math I use everyday and get anxious when I see something I haven’t used in years (like differential equations). Anyone else?
Math is a tool. And just like a hammer or a vacuum cleaner, it probably doesn’t evoke deep emotion in many of us. Still, being aware of math makes sense. Math is everywhere but you don’t have to love it.
To start the month, I thought I’d ask each of you to share your math stories. We all have some sort of feeling about math, whether it’s a deep-seated fear or passion or even indifference. How did you get to that place? What experiences did you have that influenced your feelings and thoughts about math?
You can read my math story here. (Check it out. You might be surprised!) And please share your story in the comments section. I’d love to know how each of you feel about math and what got you there. (Sad and happy stories are welcome!)
Also, don’t forget to enter this week’s Math Treasure Hunt contest on facebook. Each week, you’ll have a chance to win a copy of my book or another cool prize. Get all of the contest details here.
I say “dodecahedron,” you say “a soccer ball.” (Okay, so a soccer ball is a sphere, but I would count it for a dodecahedron, too.) (Photo courtesy of Elvert Barnes)
NOTE: THIS CONTEST IS NO LONGER ACTIVE.
How can you win a copy of Math for Grownups(or if you already have one, some other cool prize)? Check out the details for the Math Treasure Hunt contest below.
1. Each day, I’ll post a status update that features something you should find — like π or a prism or an improper fraction — in your everyday life. Once you notice this math-related something, post about it under the status update. Here’s an example:
Math Treasure Hunt Clue: A negative number (example: -4, -723, -1/2)
“On today’s weather report, the weekend forecast shows -4 degrees F for Saturday.”
(God help anyone who sees that forecast in April!)
[laurabooks]
2. Here are a few extra hints and rules:
If someone else has already posted the exact same sighting, don’t post it again. (If the clue is π, and someone has already posted that cute little cartoon about π and I, don’t post it again. Or if the clue is an octagon, and someone posts that they saw a stop sign, that one is off-limits to everyone else.) So it pays to check out the clues early. It also pays to be creative.
Want to include photos? That’s great! Think it’s okay to simply scour the internet to find an example? Nope. If I think you’re stretching, your post won’t count. (And I won’t necessarily tell you. That’s the former high school teacher in me. Meaner than a snake.)
Share your stories about what you noticed. Were you surprised? Was it something you saw or heard every day but didn’t connect with math? It’s much more fun and interesting if we hear a little bit about the thought behind your choice.
3. I’ll post a new clue each day, Monday through Friday. You can post as many discoveries as you’d like, but each one must be unique. (No fair posting the same one 253 times.)
4. For each post you make, you’ll be entered into the contest one time. If you post one unique and appropriate response each day, you’ll have five entries. If you post 15 times in a week (all unique posts, ya’ll!), you’ll be entered into the weekly contest 15 times.
5. It doesn’t matter when you post what you’ve found — just as long as you do it before Friday at midnight EDT when each weekly contest ends. So if you want to post all of your findings at one time on Friday, that’s fine. Or you can play along daily. Just make sure that your weekly entries are in before Friday at midnight EDT.
6. Each weekend, I’ll randomly select one entry from all of the posts made that week. And that’ll be our winner!
7. The next Monday, the contest starts all over again, with a new winner selected at the end of the week.
Got it? Ask questions, if you’ve got ’em. And keep your eyes peeled!
April is a big deal here at Math for Grownups. Not only do we have new digs — how do you like the redesign? — but it’s Math Awareness Month.
I saw that. You rolled your eyes. Some of you may have even groaned a little. Don’t worry — I’m not about to go all geeky on you. (Okay, maybe just a little, but it won’t be scary.) I have just one goal for Math Awareness Month: to prove that math is indeed everywhere.
So yeah, you know this already. But what do you really notice? Time to turn on your spy eyes, because you could win a prize.
Starting Monday, April 2, I’ll be giving away a copy of Math for Grownups each and every week. (Already have a copy? You could win something else.) At the end of the month, I’ll choose one more winner from all of the entries. How can you win? Join the Math Treasure Hunt on the Math for Grownups Facebook page.
But wait! There’s more! This month you’ll meet new people and learn about some really cool applications of math — all designed to help you see for yourself the role that math plays in our everyday lives. We’re going to take a break from Math at Work Monday (but it’ll be back in May!). Instead you’ll hear some folks’ math stories (and hopefully share your own), get advice from real, live math teachers (for yourself and your kids), and get the scoop on some new ways that math is making our lives easier and better (like assessing liver damage after an acetaminophen overdoses).
Want to join in? Be sure to check out the Math for Grownups Facebook page, follow me on Twitter(@mathforgrownups) and get a notice in your inbox each time a new post appears. (To do that, just fill out the little form on the right). Whether you like math or not, Math Awareness Month is for you.
Oh, and be sure to drop me a line or comment about the new blog design. I’m really excited to make things easier to find and posts easier to read.
I’ve been a fan of Project Runway since Heidi Klum, Tim Gunn and crazy Jay McCarroll stood in a room together for the first time. The stuff never gets old — from making skirts out of Twizzlers to designing wedding gowns for drama-prone models. And I’ve enjoyed many of the spawn created from Klum and Bravo’s original idea. (Well, except for 24-Hour Catwalk, which just stresses me out.)
So when I first heard about Jessica Simpson’s take on the fashion-designer reality television show, Fashion Star, I was intrigued. Not only because I like the fashion but also because of the retail aspect. In this series, which debuted on NBC on March 13, designers vie for bids from three retailers: H&M, Saks Fifth Avenue and Macy’s. After a quick and splashy runway show, featuring three original designs from two designers, buyers representing these retailers bid (or not) on the designs they want to have in their stores. A designer may get one bid, two bids, three bids or none at all. Then the designs are actually sold — the next day! — online and in stores. Instant gratification for the designers, buyers and viewers.
I’ve only seen the show once, and I don’t understand what Jessica Simpson, Nicole Richie and John Varvatos are supposed to be doing. But I’m most interested in the buyers.
That’s because not a week before on Project Runway (team Mondo!), the designers were challenged to come up with a ready-to-wear design that would not only sell in a retail store but also come in under a budget determined by a coster.
As I gathered from the episode a fashion coster determines the cost of manufacturing an item, while considering the retail value at the same time. In other words, will the retail value of the design actually cover the cost of materials and manufacturing and leave room for other costs and profit?
I imagine there was lots and lots of editing. And I imagine that the coster who appeared on the show is also so good at her job that the math comes almost second-nature. At any rate, she whipped out numbers lickity-split and with very little emotion. She would look at a design and say, “This would sell for $300.” Then she’d offer, “And you have a $48 fabric budget.” The designers “shopped” for fabric that met their budgets and their designs.
Compare this with Fashion Star. Near as I can tell, the buyers — who are sitting at least 50 feet away from the runway — don’t get a very good look at the designs. How many zippers does the skirt have? Is the fabric silk or could you get away with a less expensive blend? Are the pockets in the jacket real?
See all of these details make a big difference in materials and manufacturing costs, I would think. So when these buyers place a bid on a mini-collection, how can they be sure they’re not just throwing money at something with bigger manufacturing costs than can be covered by the retail price?
Maybe these buyers have an inside look at the designs before they hit the runway or before the bids are made. But I guess that’s my gripe about this show — why hide the math?
Unlike Rachel on Friends, real fashion buyers are not just in it for the cute clothes. Like costers, they depend on a great deal of mathematics in making the decisions whether or not to stock their racks with caftans or mini-skirts. It’s not just about what they think will sell — it’s also about what can be sold at a reasonable profit.
I’m comparing apples to oranges here, but the underlying idea is the same — whether figuring the manufacturing costs or deciding how much to bid on a design, the math is critical. Without computations of some kind, it looks like stores and designers are simply telling us what we shouldbuy, not listening to what we want.
I thought the Project Runway episode was cool. I’m less enthusiastic about Fashion Star. And for me — big surprise! — it comes down to the math.
Did you watch this episode of Project Runway? Do you watch Fashion Star? What’s your take on the magical math of these reality television programs?
ATTENTION EVERYONE! Did you know that next month is Math Awareness Month? You do now! I’m planning a big celebration here at Math for Grownups. So be sure to check out the Facebook page and blog for upcoming contests, interviews and even a new blog design!
Another book editor? Well, there’s a lot that goes into this process — from figuring out layout to determining what which book will be profitable.
Andrea Rotando has been a book editor for Barnes & Nobel and Sterling Publishing since 2001. She’s also an experienced travel writer and the editor of Luxury Cruise Bible. In our interview, she talks about calculating the profit/loss for a book — a reality check for any book author!
Can you explain what you do for a living?
I always knew I wanted to be in a creative field, but I never guessed that I’d end up in book publishing. I moved to New York City in 1991 with a music degree under my belt. I worked at recording studios until I segued into the magazine business by way of Pro Sound News and Musician magazines. Those experiences jump-started by passion for publishing and in 2007 I segued from magazine publishing to book publishing.
I joined Barnes & Noble in 2007 as a senior editor. I acquire, develop, and shepherd the production of projects for the Sterling Innovation and Fall River Press imprints. Both of those Sterling Publishing imprints exist with the express mission of creating proprietary books and kits (book + components) for the value section of Barnes & Noble stores.
I look to acquire books that will appeal to a broad section of Barnes & Noble’s customers and I also license existing content to create new packages of old favorites from third-party vendors. I work on a wide variety of topics, from crafts to cookbooks to light reference to military history.
As a hands-on editor, I’m involved in every aspect of a book’s creation, from contract negotiation to manuscript development to supervising copy editors and proofreaders and being the liaison with the production, design, and sales teams. I also supervise and mentor junior editors on the team.
Andrea Rotondo
When do you use basic math in your job?
Basic math comes to the rescue in so many ways in my job. One major way I use math is to devise and monitor project schedules. One of my responsibilities is to make sure books arrive at each Barnes & Noble store on time. This is incredibly important since promotional tables for our products are set up at the front of each store on a certain date each month and a new batch of books are displayed. If a book doesn’t hit that table on time, the company loses sales. Not only don’t we earn money for that book, we’ve undersold the capability of that table and that means our department will be under its revenue goals for the month.
I use math to calculate the length of time each part of the book creation process takes and I assign those tasks accordingly. When something goes wrong, I look at the timeline and see where it can be expanded or contracted.
Do you use any technology (like calculators or computers) to help with this math?
Sterling Publishing uses a proprietary online profit and loss (p&l) system. This is where we can log on to create or update the p&l statement for each book. The p&l includes fields for costs such as the advance to the author and his or her royalty rate as well as hard costs like editing, design, printing, and freight. The system automatically calculates the margin of the product. If the project doesn’t hit a certain acceptable margin, we don’t move forward.
I have to admit though that I often whip up “back of napkin” p&ls before going to the official system. This helps me get a sense of where the product margin is and where I have to work to trim expenses before committing to official paperwork.
How do you think math helps you do your job better?
Math is like insurance. As long as I have the raw data about a project (advance, royalty rate, number of first printing units, print costs, etc.), I can calculate if that project will be a financial success (i.e., “make its margin”). Without math, there would be a lot of guesswork as to which projects would earn out and which wouldn’t.
How comfortable with math do you feel? Does this math feel different to you? (In other words, is it easier to do this math at work or do you feel relatively comfortable with math all the time?)
Math has never been one of my strong suits but I like numbers, especially as they relate to the economic health of a project. I love being able to look at a project’s data and see where the opportunities are for the author and company to make a buck.
What kind of math did you take in high school? Did you like it/feel like you were good at it?
I don’t feel that I received an adequate education in regards to math while in high school. The courses were very basic. In college, I struggled with calculus. I’ve definitely become more comfortable with math, but I wish I had a more solid foundation from which to build.
Did you have to learn new skills in order to do the math you use in your job? Or was it something that you could pick up using the skills you learned in school?
A basic knowledge of addition/subtraction is really all any editor needs.
Any questions for Andrea? Ask in the comments section!
Ah, the trend story — we love them and we hate them. Presumably, they tell us what’s hot or not, but they also overgeneralize with very few sources. Ask a room full of writers about trend stories, and you’re likely to see a few eyerolls. Here are some examples:
It’s not that these stories are inherently bad. In fact, they’re fascinating. The problem with trend stories is that too many readers, viewers and listeners take them to the next, not-so-logical step. These stories don’t mean that all men wear buns or that even a majority of men in Brooklyn wear buns. What they actually mean is that the reporter discovered a certain number of men in Brooklyn — plus a Top Chef contestent — wearing “man buns.”
That’s because words like majority or most or average actually have mathematical meanings. What’s more, I believe we count on these words to have real meaning, rather than serving as euphemisms for something that the reporter or editor saw a few times. Even using words like many or some isn’t a great way around this. These words cloud issues, rather than elucidate them.
Let’s look at an example. For a few years, sociologists, city planners and reporters have been talking about “food deserts.” These are geographic areas where residents have very few good options for grocery shopping. Because these are poorer regions, people tend to get their food from convenience stores or fast food restaurants, because they can’t drive or take public transportation to shop for fresh fruits and vegetables.
Sounds awful doesn’t it? For a few months, I saw dozens of stories on this phenomenon. But are food deserts ubiquitous? Or were these reports based on a few examples? Thing is, we can actually find out. (Check out the link to see for sure.)
That’s where statistics come in. And reporters don’t necessarily have to do the hard work of crunching these numbers. What is really important is the ability to interpret the data. And it’s critical to know about something called the Law of Large Numbers. [pullquote]The Law of Large Numbers says that the average of the results obtained from a large number of trials should be close to the expected value.[/pullquote]
In probability, performing the same experiment over and over again (and recording the results) is paramount. Otherwise, the data and conclusions just won’t mean much. The Law of Large Numbers says that the average of the results obtained from a large number of trials should be close to the expected value.
Without going into the nitty-gritty of the math, we can use the gist of the Law of Large Numbers to apply to trend stories. If you want to know whether food deserts are a real trend, you’d better locate more than three of them. If you want to say that they’re located in urban areas, you should check rural areas too. Because if your conclusion is based on only a handful of data, it’s not worth much.
And that’s not all. If you only look at data from a set with only certain characteristics, you can’t generalize your conclusion. It might be easy for those of us who live in cities to assume that food deserts are only in urban areas, right? Perhaps this is where trend stories are most likely to fail–when the writer or editor doesn’t consider life outside his personal bubble.
In other words, if you know three female college students who are financing their tuition with the help of “sugar daddies,” that doesn’t mean this is happening all over the U.S. You’d better get some more solid data than that, or you’re not being a responsible journalist.
And for all of you readers out there, look for these signs of a trend story gone awry: most, many, some say, could be, etc. Enjoy the story, if you are so inclined, but don’t make the mistake of generalizing the anecdotes past exactly what has been reported.
In other words, a couple of guys in Brooklyn may be wearing man buns, but that doesn’t mean you (or a guy you know) won’t look out of place in your neck of the woods.
What are your favorite trend stories? Have you ever written a trend story that succeeded? If you’re a writer, what advice do you have for other writers for avoiding the trend-story trap?
It’s been a weird primary season. Like an exciting Preakness race, the remaining Republican candidates are still going strong, and in some ways, the candidacy is way, way up in the air. Unlike previous primaries, we’re no closer to a Republican candidate than when we started this whole thing.
And now the political pundits and reporters are touting “delegate math,” with headlines like “It’s math vs. momentum as Romney, Santorum fight on” (Baltimore Sun) and “Romney’s Delegate Math Still Adds Up” (Wall Street Journal). See, when an election gets or stays tight, estimations won’t work any longer — especially as folks wonder when one of the candidates is going to drop out. It’s important to pull out the calculators or actually look up how many Republican delegates are in play in Illinois (69, if you’re actually curious).
But in all of my reading and listening, I haven’t gotten a good break-down of the delegate math that people keep talking about. I want to know which states Romney has to win in order to clinch the nomination. I want to know which states Santorum has to win to present a credible threat. In other words, how hard would it be for Santorum to pull out a win? What about Gingrich or Paul?
Fact is, math can help clarify these complex ideas — or not.
DISCLAIMER 1: This is as good a point as any to tell you that this is not a political blog. In my rough analysis, which will not be precise, I am not making any statements about whom I want to win the primary. I am not registered with either party, and my political beliefs (which I’ll keep to myself here) don’t play into this post. Of course, those who disagree with my numbers will probably think otherwise, as they are free to do.
DISCLAIMER 2: This post was written on Tuesday, March 20, before the Illinois primary, so those results are not included here — nor, for that matter, are any results in subsequent primaries.
DISCLAIMER 3: I am not a seasoned political journalist, and I’ve done the best I can with a mini crash course on Republican delegates. I’ve fact checked myself as best I can, but to be sure, these counts vary from source to source. If you think you have better numbers, by all means let me know in the comments section. (Just remember rule No. 1: be nice.)
Anywho…
I’ve done some research on this in the hopes I could break this code and give to you straight — while demonstrating that math is indeed useful in reporting, despite the countless journalism majors who have difficulty with liberal arts math. (That’s a joke, ya’ll. Don’t get mad.)
In the process, I discovered the reasons that these projections are impossible: 1) not all delegates have to vote the way their primaries go, 2) some states have winner-takes-all primaries, where the winner of the primary gets all of the delegates, but 3) other states have proportional primaries, where each candidate gets a proportion of the delegates based on the vote.
But there still must be a way for math to help me (and others) understand where we’re headed — even if it’s just a rough sketch — right? Let’s take a look.
There are 2,286 Republican delegates, and in order to win the nomination, a candidate must earn 1,144 delegate votes. Here’s what the candidates have right now (according to The Green Papers, a website that makes it its business to track these delegate counts):
Romney: 407 (soft*) + 515 (hard*) = 922
Santorum: 170 (soft*) + 239 (hard*) = 409
Gingrich: 133 (soft*) + 157 (hard*) = 290
Paul: 26 (soft*) + 78 (hard*) = 104
*hard delegates are allocated votes and come super-delegate votes, while the soft delegates represent proportional votes, where the primary has been held and the proportional votes are estimated but not confirmed, or are uncertain super-delegate votes
So how many more delegates must each candidate earn before they can clinch the nomination (assuming that all of the soft delegate counts will become hard delegate counts)?
Romney: 1,144 – 922 = 222 delegates
Santorum: 1,144 – 409 = 735 delegates
Gingrich: 1,144 – 290 = 834 delegates
Paul: 1,144 – 104 = 1,040 delegates
See, to me these numbers tell a much clearer picture, but some additional comparisons would help. For example, what percent of the winning delegates does each candidate have, according to these numbers?
Romney: 922 ÷ 1,144 = 81%
Santorum: 409 ÷ 1,144 = 36%
Gingrich: 290 ÷ 1,144 = 25%
Paul: 104 ÷ 1,144 = 9%
(Notice, this doesn’t mean that Romney has earned 81% of the delegate votes. It means he’s earned 81% of the delegate votes he needs to come on top at the convention. And of course by earned, I mean these delegates have been identified as likely (or definitely, depending on the state) voting for Romney at the convention.)
For weeks, we’ve heard that Romney and Santorum are running neck-in-neck. But when you look at those percentages, well, they paint a different picture. Still there’s another number that I think would really help: the percentage of remaining delegates that each candidate must win.
Let’s assume (and this is a big assumption) that there are 1,725 delegates still up for grabs and (another big assumption) that all of the soft delegate counts will become hard delegate counts, just as they are noted here. Then the candidates would need to win these percentages of the remaining votes in order to secure the nomination.
Romney: 222 ÷ 1,725 = 13%
Santorum: 735 ÷ 1,725 = 43%
Gingrich: 834 ÷ 1,725 = 48%
Paul: 1,040 ÷ 1,725 = 60%
There’s a huge difference between 13% and 43%. I’m not saying that it can’t be done. But with these numbers, this doesn’t look like a close race any longer.
I’m not saying that these are the be-all, end-all numbers that should be used to describe the Republican primary. But I am saying that math can help us understand where the candidates stand. And we absolutely should not depend on the candidates themselves to give us this analysis. Instead, journalists should be spending time with a pencil, paper and calculator (or a spreadsheet) — and some reliable sources — to figure these things out for their readers.
Any thoughts on how the math has been used in reporting this political race? Share them in the comments section.
Welcome week three of our month devoted to publishing and media. If you haven’t previous posts, what’s stopping you? So far, we’ve looked at book publishing and on-air meteorology (television weatherpersons). This week, it’s time to look at writing. Today you’ll meet Craig Guillot, a freelance writer in New Orleans, who specializes in finance writing, among other things. Craig is the author of Stuff About Money: No BS Financial Advice for Regular People, an ebook, which he says will be available in April. (I’m a source for one section!)
Bottom line? Math helps keep Craig profitable. So if you’re a budding freelance writer–or looking for ways to leave more on your bottom line–listen up.
Can you explain what you do for a living?
I’m a non-fiction freelance writer. My specialties include business, personal finance, retail, real estate, travel and entertainment. I’ve written for publications and web sites, such as Entrepreneur, CNNMoney.com, Washington Post, Nationalgeographic.com and dozens of trade publications. I also have a personal finance book Stuff About Money: No BS Financial Advice for Regular People.
When do you use basic math in your job?
In the actual writing, not much. Just like any other writer or journalist, I interview sources, research, take trips out in the field, gather information and write. I occasionally do a little photography and video too. I do use math on occasion in some of my personal finance work to demonstrate and calculate different things related to retirement and investing.
But I use math a lot in the background. Writing just happens to be my trade. Like any other self-employed person, I am ultimately running a business. As a freelancer I sell my services to editors and corporate clients. I have a lot of regular clients, but I’m constantly taking on new projects and new deals. I need to be able to carefully estimate my time and expenses to give a client an accurate quote.
To me, everything is about the hourly rate. I need to use this as a basis for building my income. And while my overhead isn’t much, I do have to know what’s going out to pay taxes, what’s going into savings, retirement and everything else. It may seem like part of my personal life but I consider it all part of my job. When you’re self employed, you have to constantly think about all of these things.
Do you use any technology (like calculators or computers) to help with this math?
I’m not sure I even have a calculator in my office anymore, but my main tool is Excel. I use it for everything, and I mean everything. It’s a calculator but so much more. There is no problem that can’t be solved, no analysis that can’t be made, in Excel. When you learn how to use it and how to write the formulas you need, you can do anything with it. I use it to analyze my revenues, analyze the profitability of certain assignments. Like everyone else, I use Quickbooks, but I also use Excel for background stuff.
I break everything down to a formula or percentage. This includes my monthly income goals. It doesn’t have to be that way. I don’t imagine it’s that way for many other writers but it works for me and helps me make the optimal decisions. I’ve used Excel to track, analyze and compute things in my regular life as well. I used it in the remodeling of our house, in tracking my net worth, in monitoring my investments, planning retirement, planning trips. I sit down, make up a spreadsheet, build some formulas, input the data and then use it to help make decisions. I run marathons and even use it to track my training runs and races. The more you learn how to use Excel and write formulas, the more uses you find for it.
How do you think math helps you do your job better?
One way it helps me is with analyzing my hourly rate and profitability. Whenever I take on special projects for a corporate client or a custom publisher, I use it to give a quote. I prefer to work on a project rate. I give them a single number but behind that is a lot of math that I have used to arrive at that number. They don’t need to know any of that.
I may also build in a variance. It will let me know if I might be able to live with a cut in that number. So if they want to try to negotiate that down a bit, I know that I can drop by 5%, 7%, 10% or whatever it might be for me to still make what I need to make.
I also need to factor in opportunity cost. That is what else I could be doing with my time. Do I take this project which will tie me up for three weeks or do I decline it and go after smaller but potentially more lucrative projects that will make my time more flexible? I use math to figure all this out.
How comfortable with math do you feel?
In relation to personal finance and business math, I feel very comfortable with it because I use it so much and see the value in it. But all the standard stuff you learn in school? I really don’t remember any of that. I’d have to pull out a book and look up some formulas if you wanted me to calculate cubic volume or something like that.
What kind of math did you take in high school? Did you like it/feel like you were good at it?
Just the basics. Algebra, geometry, standard high school stuff. I wasn’t particularly good at it, I was just average. But I majored in business in college and took a lot of accounting, finance and business math classes. I always excelled at those and had a stronger interest in them. Math dealing with money just felt real to me. There was an instant connection of “Oh, I could actually use this someday.”
Did you have to learn new skills in order to do the math you use in your job? Or was it something that you could pick up using the skills you learned in school?
I did pick up some new skills, but a lot of the business and personal finance math I used today can be traced right back to college. The fact that I actually enjoy this kind of math really helps.
Anything else you want to mention?
Yes. I believe that many of our growing financial problems in this country—like people getting into mortgages they couldn’t afford, our lack of savings, our failure to put enough money away for retirement, our problems with credit card debt—can be traced partly to our failure to use math in our financial lives. People buy homes and cars on emotion but rarely run the numbers. They wouldn’t use debt to overspend if they really knew the long-term consequences. There is a numerical answer for everything in your finances. You have to know why that number is important, how to calculate it and how to use it.
Any questions for Craig? I’m sure he’d be happy to answer them!
Okay, I’ll admit it. I don’t typically watch television news. (Sorry Tony!) But when bad weather comes along, seeing those weather maps is often exactly what I’m looking for.
I lived in a hurricane prone area for 15 years, weathering (eh-hem) many a storm and getting through some close misses. When you see that many big storms, you get used to the terminology (like storm surge) and develop a false confidence in your own ability to predict what’s coming.
But as you know, a gut feeling isn’t enough. In fact, meteorologists use a complex system of previous data and what they know about how these storms act to make predictions. What they’re saying, though, is that there is a chance something will happen. And what is that based on? Probability and statistics.
You know when you were little and you got sick on your birthday? It’s not quite the same thing, but I was down and out yesterday — on Pi Day! (I didn’t even get to wear my “cool” Pi sweatshirt.) So I bring you these little tidbits a day late.
What’s Pi Day, you ask? Flip back to yesterday’s calendar: March 14 or 3-14. Now think about the estimation of π or pi: 3.14. Ta-da!
Here are a few ways folks have celebrated Pi Day, thanks to the watchful eyes of my wonderful Math for Grownups readers.
Amherst College, 2004: “On March 14, or 3.14, students celebrated National Pi day by waking up at 6 a.m. and burning through 15 sticks of sidewalk chalk. Here, digits of pi trail off in front of Fayerweather Hall on National Pi Day. 2,010 digits of pi stretched from Valentine Dining Hall to Merrill Science Center.”
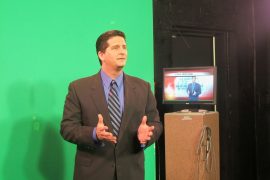
Quick! What do you have to know before changing from your jammies into something a little more work appropriate? The weather, right? Tony Pann is an on-air meteorologist for WBAL-TV 11 in Baltimore, Maryland. Math helps him predict if there are sunny skies ahead or if you’ll need to pack your umbrella. Here’s how.
Can you explain what you do for a living?
I have been a television meteorologist for 22 years. Since 2009, I’ve been working as part of the morning team at WBAL TV.
When do you use basic math in your job?
I use math everyday! The computer models that we use to forecast the weather, are based on very complicated formulas derived from fluid dynamics. The atmosphere acts very much like a body of water, so the same mathematics can be applied to both. Each day, over a dozen different computer models are run predicting the state of the atmosphere at different time frames. An initial set of data is entered at a specific starting time, then the model shows us it’s interpretation of what the state of the atmosphere will be at certain time intervals. For example, the data might be entered at 7 a.m., then the model will predict the temperature, wind speed, and barometric pressure at 10 a.m., 1 p.m. and 4 p.m. Some of these models are short range, and only extend out to 48 hours, while others go all the way out to 365 hours from the starting point!
So let’s say there are 13 models that do this same thing each and every day, two or three times a day. It’s my job as a meteorologist to interpret all of that data, and translate it into the very understandable and reliable seven-day forecast that you see on TV. With so much data out there, the intuition and experience of the forecaster is very important. Since each model takes in the same starting data, but is run on a different formula, they all come up with different answers. For example, one model might say the high temp for today is going to be 45 and another could say 50. Or one could predict 6 inches of snow and the other says 1 inch. It’s my job to decide which one is right and why.
Sometimes I don’t trust any of them, and I’ll do a quick calculation on my own. Here’s an equationthat I can use to calculate the high temp for the day by hand:
T_max = (Tk_{1000 – 850}*0.36)-422
where T_max is the potential high temperature and Tk_{1000-850} is the 1000mb to 850mb thickness in meters.
I then go on TV, and try and explain it all in an interesting manor — at least that’s the goal.
Did you have to learn new skills in order to do the math you use in your job?
In order to get a degree in meteorology, you actually have to learn all of the math that the computers are doing to give us those answers. It’s not easy! By the time we are finished, we’re just a class or two short of having a minor in mathematics. It’s great to know what the computers are doing, but I’m glad we don’t have to work it out by hand anymore. If not for the wonderful training in the world of mathematics, I most certainly would not be doing this job.
Do you have questions for Tony? Ask them in the comments section, and I’ll let him know to peek in!
So you’ve got a brand new book on your nightstand or electronic reader. Or maybe you have a book idea that you’d love to get published. How on earth does an idea get translated to pages or bytes? A book editor could play a big role. Jennifer Lawler was my editor for Math for Grownups, and these days, she’s the imprint manager for Adams Media’s new direct-to-ebook romance imprint. Today, she answers the big question we have here on Mondays: How do you use math in your job?
Can you explain what you do for a living?
I’m an imprint manager for a book publishing company, which means I acquire books from writers based on what we think our readers will want to read. Then I shepherd the books through the entire editorial and production process, which includes everything from negotiating contracts to approving cover design to making sure the publicity department is doing its job. My job constantly switches from big-picture items like “How does our imprint differentiate itself from other imprints like it?” to nitty-gritty items like “did that copy editor ever send over her invoice?”
When do you use basic math in your job?
I have a set budget for producing each title, but not all titles are alike, so they require different amounts of money. I have to make sure that each book gets what it needs without going over the budget as a whole, and also without being really out of whack for any one title. This is very similar to keeping a household budget and balancing a checkbook.
For nonfiction print books, I have to calculate how to make them fit into the allotted page count we have for them. At my company, page count is determined at the time a book is signed, based on the type of book it is, what the cover price will be, and other factors. Since nonfiction books are sold on proposal, not finished product, the finished product can vary significantly from what we assumed it would be at the time of signing. So I have to figure out what we can do to make the book fit. Can we add pages to the index, or subtract pages from the index? Can we add or subtract front matter? Can we go up to 2-page chapter openers or down to 1-page part openers? We can’t go over or under more than 16 pages for any project. Usually it’s not a big problem but sometimes you should see my desperation!
Do you use any technology to help with this math?
We use a special calculator based on trim size to estimate how many words per page, taking design considerations into account (lots of sidebars or illustrations mean fewer words on each page). For the budget, I just use a spreadsheet. This just helps make sure simple errors in addition or subtraction don’t through the whole process off.
How do you think math helps you do your job better?
On a fundamental level, if I don’t do the math right, the company and everyone in it suffers. We miss our projections, we overrun our budgets, we even screw up our earnings. That’s a big deal. It also helps me be creative and to make better judgment calls. If I find myself saying, “Well, it doesn’t really matter if this one book doesn’t fit the page count, I can just get the publisher to change the page count,” I know I’m being lazy. Maybe that is what has to happen sometimes, but that type of change directly impacts our profit-and-loss statement for the title, so it has to be the last resort. Same with the budget. “Well, the publisher isn’t going to kill me if I go over by a little bit.” That’s true, but it’s a lazy way of thinking. Doing the math makes me think about what I need to do differently to hit the budget. In some instances, yes, the budget simply needs to be bigger. But it could mean I need to watch what I acquire so I’m not picking up things with potential but that require a ton of editing. It could mean I need to streamline a process somewhere or develop a template instead of doing some type of custom approach each time.
Math adds a lot of clarity to my work—something I never thought a book editor would say!
How comfortable with math do you feel?
I am pretty comfortable with math except when I am put on the spot (like someone asking me point-blank to answer a math question). I find the math at work to be easy in the sense that I’m confident about not making mistakes with it. I do it in the privacy of my office, so if I have to check my calculations five different times to make sure I’ve got them right, I do it.
What kind of math did you take in high school?
I got as far as Algebra II and felt like a complete idiot by that point.
Did you have to learn new skills in order to do the math you use in your job?
I had to get over my fear of “oh my god I will screw up the math and they’ll kick me out and I love this job!” Other than that, though, the math is straightforward—definitely something a high-school kid could do. Probably a third-grader could do it
Thanks for playing with us today, Jennifer! If any of you dear readers are interested in writing and publishing a book, check out Jennifer’s great book proposal class. (I can recommend it from personal experience!) Or feel free to ask her a question in the comments section.