Category: Math for Grownups

  • Math Awareness Month: What’s Your Story?

    Math Awareness Month: What’s Your Story?

    Lots of people make one of two incorrect assumptions about me. I’m a writer, so they initially assume that I don’t have a good relationship with math. And when they find out that I have a degree in math, they assume that I love to sit down and solve trigonometry problems all day long.

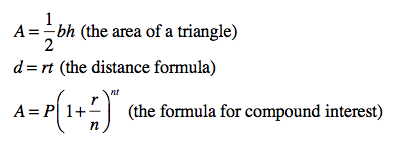
    Sure, I like math. I’ve said it a hundred times – math is a useful tool. I feel comfortable using math to figure out problems that I have, like how much fabric I need to order to recover my couch or the number of calories in a 3/4 serving of granola. (Yes, I actually do that second thing on a regular basis.) But I’ve never been head-over-heels in love with math.

    What do I really love? A good story. And so for the third year, I’m inviting you to share your math story. Telling others how you came to love, like or hate math is an interesting process. I’ve learned that education – and particularly teachers – make a huge difference in how people feel about math. Get a great teacher, and you have a much better chance of at least coming out of the class appreciating math. But a burned out, cynical or, worse, mean teacher can destroy any positive feelings a student might be cultivating about math.

    Why share your story now? Well, April is Math Awareness Month, which is not about appreciating math. Nope. The goal of this month is to simply encourage people to notice the math around them. (Which is also my personal goal with this blog and my book.) The first step can be telling the story that helped form your impressions of math. Is there something blocking your understanding or appreciation? Could be.

    Before you share your story, you may want to read some others’. Start with mine, and then check out how math almost ruined Lisa Tabachnick Hotta‘s life and how Siobhan Green learned to use math, despite an early bad experience.

    Then tell your story in the comments section. Do you like math, hate it, don’t care one way or the other? Does math make your hands sweat? Why do you think you have these feelings about math? Do you have a sad story — giving up and giving in? Or did you triumph? Whatever your personal experience, I want to hear from you. And if you’d like more space, feel free to contact me about a special guest post.

    So what are you waiting for? Share your story today.

    P.S. The official theme for this year’s Mathematics Awareness Month is sustainability. That’s a wonderful topic, but I think for many of us, it’s a little esoteric. So I’m going to pull back and focus on some more mundane topics this month. However, math educators should check out the Math Awareness Month website for ideas on how to relate this theme to the classroom. There are some really cool resources there.

  • Finding the Funny in Algebra

    Finding the Funny in Algebra

    So the person who inspired this series on Algebra is my dear friend Michele “Wojo” Wojciechowski – a very funny writer and stand-up comic. In her honor, I thought I’d wrap things up with a post looking at the humorous side of algebra.

    When something makes us uncomfortable, we make fun of it. I mean, why not, right? As a first-year teacher, I remember giving a geometry test, on which I asked students to define space. One student wrote: “The final frontier.” And I have to admit that I laughed.

    So, whether or not I’ve convinced you that algebra is a useful, everyday skill, at least join me in a little laughter today. And be sure to come back next week, when we start celebrating National Math Awareness Month. (The excitement never ends, does it?)

    These next two are great for math teachers, as they demonstrate very common errors that students make.

    You have to be a Harry Potter geek to get the next one:

    Happy weekend, everyone! Use some algebra and make the world a better place.

    Got any math jokes? Feel free to share them in the comments section.

  • Building Formulas: Spreadsheets, algebra and guest lists

    Building Formulas: Spreadsheets, algebra and guest lists

    The classic answer to the question, “When am I going to use algebra?” is spreadsheets. Now I will admit straight up — I am a spreadsheet junkie. I’ll build one for just about anything, from menu planning to blog schedules to tracking which clients have sent me 1099s. And I know for a fact that this attraction to spreadsheets is not normal. I promise, I will not try to convince you that spreadsheets are the be-all-end-all (though I think they are) or that using a spreadsheet will make your life easier (though it could).

    But there’s no denying one important thing: algebra is extremely useful in spreadsheets. And that’s because the power of a spreadsheet is in its ability to crunch numbers for you.

    In fact, algebra teachers are using spreadsheets to help students better understand algebra and its real-world uses. Want to see how data is related? Use a spreadsheet to create a line of best fit. Want to find an average quickly? Spreadsheet. Want to know how many children and adults you’ve invited to your wedding? Open up Excel or Numbers or OpenOffice Spreadsheets.

    (Yes, we’re back to the wedding. It’s consuming my life right now, so you get to play, too.)

    When it came time for me to create the guest list for my wedding — undeniably the most painful part of this entire experience — I naturally reached for good-old Excel. Once I had everyone entered into a spreadsheet, I was able to create a variety of formulas that have helped me manage certain tasks. Here’s an example.

    Our reception venue, which also provides the catering, offers a much lower rate for children. They’re getting chicken tenders, rather than the fancy-schmancy meal, so that’s only fair. But there are a lot of kids on our list, and I needed to get a rough estimate of what we would pay. This way, I could make really good decisions about who we could and could not invite. (Told you, this part was really painful.)

    Each family, couple or person was listed in one row of the spreadsheet. In two of the columns for each row, I included the number of adults and kids who were invited.

    Ann Laing22
    Melissa Zach246
    Drew Laing22
    Graham Laing22

    So you can see that my sister, Melissa, has 4 children under 16 years old, while my mother and two brothers don’t have any. But each of their families has 2 adults. The column all the way to the right is the total people in their families who are invited. In fact, I used a very simple formula to find the last column: =SUM(B2:C2). This means, “Take the sum of the values in columns B2 through C2.” The formula allows me to make changes to the values in columns B2 through C2 and automatically update the last column.

    But that’s not really where the algebra comes in. At the bottom of my spreadsheet, I use the SUM formula to total the number of kids and the number of adults. Then I use those values to find the cost of the reception food, using a formula I built. Here’s how that worked.

    Let’s say I’ve invited 15 kids and 100 adults. I’ve let my spreadsheet automatically find those totals in cells B101 and C101. And let’s say that the cost per adult is $50 and the cost per child is $25. Algebra will help me create a formula based on the cells where this data is found.

    =((B101*50)+(C101*25))

    Looks ugly, right? Well, that’s because the spreadsheet needs some extra formatting to recognize the formula. But there’s a simpler way to show this:

    y = 50a + 25k

    In other words the total cost for the food (y) is equal to 50 times the number of adults (a) plus 25 times the number of kids (k). Algebra at work in the real world of wedding planning.

    My job today is not to explain the algebra to you step by step. But I did want to demonstrate one really useful — and somewhat common — way that a regular person uses algebra in their regular life. (Okay, so maybe I’m not regular, but hopefully you get my drift.)

    Do you use spreadsheets? What formulas have been useful to you in your spreadsheets? Did you think of that as algebra? Why or why not? Share your thoughts in the comments section.

  • Say “I Do” to Algebra: Using math to plan a wedding

    Say “I Do” to Algebra: Using math to plan a wedding

    There must be a special circle of hell for those of us planning our weddings and receptions. I know this first-hand, because I’m planning my own nuptials for this summer, and I’m about to pull my hair out. (No wait! If I do that, I’ll ruin my opportunity for the perfect up-do!)

    Weddings are magical events, filled with joy and love. They’re also damned expensive. Crazy costly. The average wedding in my neck of the woods costs about $25,000. Sure, couples can opt for a family BBQ or a quiet ceremony in a public park. But when you’ve waited as long as I have — I’m 45 years old — there’s no backyard large enough for everyone who wants to be there.

    And that’s the variable that matters in wedding planning — the number of guests. The smaller the guest list, the smaller the budget. When the guest list grows, you can expect to shell out a lot more. That’s because the biggest cost of a wedding is the reception — unless you’ve got your heart set on the latest gown to walk the runway in Paris.

    If you’re like me, there’s some flexibility in this list. Children or no children? Cousins or just immediate family? What about college friends you haven’t seen in years or office mates? All of these decisions have a direct affect on your bottom line. And this is where the algebra comes in.

    Many reception venues follow a simple formula: a flat rental fee, plus a per-person rate. If the number of guests is the variable, you can easily set up an equation to help you settle on the number of people you can afford to attend the reception. Here’s an example.

    Let’s say that the venue you’re considering has a flat rental fee of $3,000. In addition, there’s a $75 per person rate to cover food and drinks. (Of course, this rate depends on the menu chosen, plus other add ons, like upgraded linens, top-shelf liquors, etc.) Basically, you need to multiply the per-person rate by the number of people invited and then add the flat fee. In other words:

    In this equation, y is the total cost of the reception venue, and x is the number of guests. Break it down, if you’re confused: The total cost of the reception venue is $75 times the number of guests, plus $3,000.

    But why take the time to write an equation? Well, this allows you to play with the number of guests or your total budget. For example, if you know you want to invite between 150 and 200 people, you can come up with a range for your budget:

    In this scenario, you can expect to pay between $14,250 and $18,000, depending on your final number.

    More likely, you know your budget and want to find out the maximum number of people who can attend the wedding. For example, if your budget for the reception venue is $15,000, how many people can you invite?

    With a budget of $15,000, you’ve got a guest list of 160 people.

    The beauty of creating an equation to help in this problem is that you can play around with the numbers. Once you have the equation, you can try different things, without thinking too hard. And if you’re comparing the costs of several venues or several packages at one venue, you can create several — very similar — equations, one for each option.

    I get it. Most brides and grooms aren’t going to take this step. Who wants to do math when planning one of the most magical days of their lives? But this is a clear example of how algebra can reduce the stress of planning a wedding — and possibly save you some cash.

    So what do you think? Have I convinced you that algebra can be useful? Share your thoughts in the comments section. And how have you saved money in planning your wedding? Did math help at all? Dig deep and be honest!

  • It’s Not Tomato Season Yet, But You Still Need Algebra

    It’s Not Tomato Season Yet, But You Still Need Algebra

    So I’ve been harping on the fact that math is flexible. And I’ve also said more than once that we do the math that we need to do. (No one here is suggesting that calculus computations are necessary for everyday life.) In fact, because of those first two facts, we often don’t need to write down literal equations at all – we might not even know we’re using a formula.

    Here’s an example: Let’s say you need to build a fence around your tomato plants. If you know that the bed is 4 feet by 2 feet, how much fencing do you need? (Yes, I’m ready for spring and summer and fresh veggies. Will this cold weather ever end??)

    This is a perimeter problem. Some of you might write down the formula for perimeter of a rectangle: P = 2l + 2w. But I’d be willing to bet that most of us simply add: 4 + 2 + 4 + 2 = 12 feet. No formula needed, right?

    But what if we turn the problem on its head? Let say you have 12 feet of fencing, and you’re building a tomato plant bed that must be no longer than 4 feet. How wide can the bed be?

    Again, there are tons and tons of ways to approach this problem. One is with literal equations. What do you know about the information you have? The perimeter and the length. What are you solving for? The width.

    P = 2l + 2w

    The object of the game is to solve the formula for w, in terms of P and l. (Stay with me here. I promise this is easier than that previous sentence made it sound.) To do that, you need to get w by itself on one side of the equation. This is where the algebra comes in.

    The most important rule about solving algebraic equations is this: Whatever you do to one side of the equation, you must do to the other. Period. End of Sentence. Amen. Shalom. To do that, you need to undo the operations. It’s like taking something apart. Here’s how it works:

    Don’t panic! This is not as messy as it looks. All you need to do now is substitute what you already know, use the order of operations to simplify, and you’ll have w.

    So the width of the tomato bed must be 2 feet. My point is not that you must always solve a problem like this one in this way. Nuh-uh. My point is that there’s algebra behind this problem – no matter how you solve it. And whether you like it or not.

    How would you have solved this perimeter problem? See if you can spot the algebra in your approach. And share in the comments section.

    I am so pleased to be Meagan Francis‘s guest this month on The Kitchen Hour, her 45-minute podcast for parents on the go. We talk about math anxiety, math education and how to encourage our kids to embrace math — while overcoming our own fears. Listen and/or download the podcast at The Kitchen Hour.

  • Happy Pi Day!

    Happy Pi Day!

    In celebration of 3-14 or Pi Day, I bring you 10 interesting facts about the number π.

    1. The number π is the world’s most recognizable constant.

    2. π is equal to a circle’s circumference divided by its diameter. It is approximately 3.14159, though the number never stops and never repeats.

    3. The symbol for pi – the Greek letter, π – has been used for about 250 years.

    4. The first 144 digits of π add up to 666 or the mark of the beast. (Math must be evil.)

    5. In 2008, a Wiltshire crop circle appeared, representing the first 10 digits of π.

    6. The number 360 is at the 359th digit of π. The number of degrees in a circle is 360.

    7. Albert Einstein was born on Pi Day in 1879.

    8. The sequence 123456 never appears in the first million digits of π. However, 12345 appears eight times and 012345 appears twice.

    9. At the Pi Search Page, you can find numbers – like your birthday, zip code, phone number – within the first 200 million digits of π.

    10. The reflection the number 3.14 resembles the word PIE.

    Happy Pi Day! Do you know any other fun facts about πShare your ideas in the comments section.

  • Using Algebra – Literally

    Using Algebra – Literally

    Parks and Recreation, the Amy Poeler-driven mocumentary on NBC about a small-town parks department, features a tightly wound character, Chris Traeger, whose favorite word is literally – as in: “Biking for charity is literally one of my interests on Facebook.” It’s funny because it makes us grammar fanatics crazy. Literally is literally one of the most misused and/or overused words in the U.S.

    I had never seen the word applied to mathematics until recently. No kidding! That’s when I learned about literal equations. I mean, I already knew about them; I just didn’t know what they were called. And yes, you know about them too. They’re one of the ways that we use algebra in our everyday lives – without even knowing it.

    Literal equations are equations with more than one variable. Ta-da! See, you knew about them, too. Here are some examples, in case you’re not convinced:

    Look at all of those variables. Each equation has more than one, which means that each of the above is a literal equation. That’s it. Easy.

    Now, the algebra of literal equations is much, much easier than most mathematics, especially if the equation is simple, like the distance formula. (Don’t panic. This is not one of those train-leaving-Pasadena questions.) The algebra is in identifying the variables, substituting into the equation and then solving.

    Let’s say that you’re an avid cyclist. In fact, you’ve got all the cool accouterments, like a gel-padded seat, clip-on pedals and a speedometer. You average about 16 miles per hour on flat roads, and you love trying out new routes, just riding where your bike takes you. But it’s critical that you know the half-way mark for most of your routes – otherwise, you won’t have enough steam to get back home.

    That’s where the distance formula can come in.  If you know your speed (or rate, r) and the time you’ve been out, you can find the distance. This way, you know when to turn around and head back to enjoy those endorphins.

    One gorgeous Saturday morning in March, you head out on an unfamiliar route, cruising at about 16 miles per hour. Checking your watch, you find that you’ve been on your bike for half an hour. How far have you traveled? You can actually do this math in your head – just multiply 16 by 0.5. How do I know this? With the literal equation d = rt.

    See? You just used a literal equation. And you did it on your bike. As Chris Traeger would say, “You are literally the most impressive cyclist I know.”

    How have you used literal equations recently? Want to share in the comments section? Feel free. Also, feel free to challenge my thesis that algebra is an important part of a solid middle and high school education. I can take it. Really.

  • Coloring Inside the Lines: How algebra helps

    Coloring Inside the Lines: How algebra helps

    Math is black-and-white, with right-or-wrong answers. It’s hard to color outside the lines in math.

    While I often argue with this point, there is some truth to it. Just like grammar, chemistry and baking, math is a pretty precise subject matter. Sure, there are many different ways to add 24 and 37 in your head, but fact is, you can’t just decided that the answer is –19, right?

    Rules make math work. And algebra helps us write down these rules. Now, we don’t necessarily need to think of math rules in this way, but believe me, when teaching and writing about math, it sure does help. And there are some real-world situations when an equation can  really help make math easier.

    Let’s consider the process for multiplying fractions. Do you remember what it is? Take a look at this problem, and see if you can figure it out:

    Of course there are several ways to describe what is happening above, right? You can do it in plain English:

    To multiply two fractions, multiply the numerators and multiply the denominators.

    Or, you can write this using algebra. This is not as hard as you might think! First, assign a variable to each of the unique numbers on the left side of the equation:

    a = first numerator

    b = first denominator

    c = second numerator

    d = second denominator

    Then substitute those variables for the numbers themselves:

    Now, perform the rule that was described in plain English above: multiply the numerators and multiply the denominators.

    How about that! Lickity split, we made like mathematicians and created a rule described algebraically. How hard was that really? 

    Now you can use this rule to multiply any fractions of any kind. I don’t care if they’re elementary fractions made up of just numbers or if they’re fancy-schmancy algebraic functions that have — gasp! — variables in them. You don’t even have to think of the abc or d. Instead, think of those variables as place holders. (Hint: this is where your mind can be really flexible, even though the rule is not.)

    Because you know this rule, you can solve this problem (even with the x and the y). Just multiply the numerators and then multiply the denominators.

    Because of the rule for multiplying fractions — which includes the variables aband — you can see how to multiply any fractions. That’s where the algebra comes in handy.

    Now, I know exactly what you’re thinking. When will I ever need to solve a problem like the one above. And here’s my honest answer: for most of you, never. Really and truly. I won’t lie.

    However, there are times when creating a rule for a specific real-word problem is very useful. That’s when we might create an equation. Stay tuned, when we’ll talk wedding receptions, guest lists, the price per person and rental fees.

    So what do you think of algebra and math rules? Did this example help you understand how algebra is important in developing and stating these rules? Do you disagree with me about why this is important? I can take it — so please do share your thoughts in the comments section.

  • Numbers and Letters Together: What is algebra?

    Numbers and Letters Together: What is algebra?

    A Math for Grownups follower asked me earlier this week to define algebra, and I thought that was an excellent place to start this month-long discussion. I think that most people might be surprised by what is generally found under the algebra tent. The basic definition is pretty broad:

    Algebra is a branch of mathematics that uses letters and other symbols to represent numbers and quantities in formulas and equations. This system is based on a given set of axioms.

    What does this mean? Well, it’s basically the step beyond arithmetic, where we only deal with numbers. Algebra allows us the flexibility of an unknown — the variable — so that we can make broader statements about situations.

    Look at it this way: 8 + 3 is always 11. Always. But 8 + x depends on the value of x. This means we can pretty much substitute whatever we want for x. See? Flexibility. (Of course 8 + x has no meaning without some kind of context. But we’ll get to that later in the month.)

    Algebra allows us to discover and create rules. These rules might be formulas or equations that describe a particular situation. Because of algebra, we know that the circumference of a circle is 2πr, where π is the number 3.14… and r is the radius of that circle.

    Now, let’s take this definition one step further. What is the circumference of a circle with radius 1?

    C = 2πr = 2π(1) = 2π

    But what about the circumference of a circle with radius 2?

    C = 2πr = 2π(2) = 4π

    If you look closely at this, you can draw a conclusion: The larger the radius of a circle, the larger its circumference. When the radius is 1, the circumference is 2π; when the radius is twice as long, the circumference is twice as big.

    This points to a critical aspect of algebra: relationships.

    Algebra is a branch of mathematics that deals with general statements about the relationships between values, using numbers and variables to describe them.

    The formula for the circumference of a circle is a description of the relationship between the circumference and the radius of any circle. When the radius changes, so does the circumference. When the circumference changes, so does the radius. (π is a constant, even though it is technically a Greek letter. Whenever you see π, you know you’re dealing with the number 3.14…)

    So that’s it. Algebra is nothing more than a way to describe the relationships between values (numbers, measurements, etc.). In the example of circumference, we’re dealing with two branches of math. The geometry describes why the circumference is twice π times the radius. The algebra is how we describe that relationship in the form of a formula.

    Without algebra, we really don’t have ways to describe many things about our lives — from geometry formulas to finding compound interest on a loan. We can fumble around and come to a conclusion, but in the end, algebra can make this process much simpler.

    What do you think about these definitions of algebra? Does thinking about algebra in these ways make it a little less threatening? If so, how? Share your ideas in the comments section!

  • Algebra: What good is it anyway?

    Algebra: What good is it anyway?

    Hating on algebra is all the rage these days. From New York Times editorials to cute little Facebook images, it seems that we’re settling into a big assumption: algebra is not useful to the average person. For the most part, this idea is pretty harmless. When I see those Facebook posts, I generally smile to myself and think, “Oh you’re using algebra. You just don’t know it!” (And yes, sometimes I say this out loud. I work alone, and my cats don’t care.)

    But of course when there are calls to remove algebra from high school math curriculum, things get pretty serious. If you had driven past me at lunch time one fall day last year, you might have seen me (literally) shaking my fist and shouting at my radio. My local public radio station was airing a talk show featuring some doofus (I think he was a philosophy professor?) who was advocating that we actually stop teaching algebra. Seems it upsets students too much and, heck, we don’t need it anyway.

    Want to make me mad? All you have to do is suggest this in a serious way.

    So, prompted by all of the online ribbing that I get from people, I’ve decided to take on a challenge. This month, I’ll be writing about exactly how algebra is useful. My goal is to convince anyone who thinks differently that they’re wrong. But I know this is a tough sell. So I’ll settle for a couple of small concessions.

    My thought is that I’ll focus on everyday uses for algebra (from spreadsheets to formulas), algebraic thinking (how we can think critically, thanks to algebra) and why I believe algebra is a cornerstone subject for middle and high school students.

    Want to challenge my thinking? Go right ahead! Want to offer your own experience? Please do! I’d love to promote a real conversation on this topic. I can always learn something new about how real, live people use the math devoted to finding x.

    In the meantime, share your algebra story in the comments section. I’d love to hear from everyone — whether algebra was the first time math clicked for you or you were one of those folks who said forget it, once letters were introduced to your math.

  • That’s So Random: Getting sampling right

    That’s So Random: Getting sampling right

    On Wednesday, we talked about sample bias, or ways to really screw up the results of a survey or study. So how can researchers avoid this problem? By being random.

    There are several kinds of samples from simple random samples to convenience samples, and the type that is chosen determines the reliability of the data. The more random the selection of samples, the more reliable the results. Here’s a run down of several different types:

    Simple Random Sample: The most reliable option, the simple random sample works well because each member of the population has the same chance of being selected. There are several different ways to select the sample — from a lottery to a number table to computer-generated values. The values can be replaced for a second possible selection or each selection can be held out, so that there are no duplicate selections.

    Stratified Sample: In some cases it makes sense to divide the population into subgroups and then conduct a random sample of each subgroup. This method helps researchers highlight a particular subgroup in a sample, which can be useful when observing the relationship between two or more subgroups. The number of members selected from each subgroup must match that subgroup’s representation in the larger population.

    What the heck does that mean? Let’s say a researcher is studying glaucoma progression and eye color. If 25% of the population has blue eyes, 25% of the sample must also. If 40% of the population has brown eyes, so must 40% of the sample. Otherwise, the conclusions may be unreliable, because the samples do not reflect the entire population.

    Then there are the samples that don’t provide such reliable results:

    Quota Sample: In this scenario, the researcher deliberately sets a quota for a certain strata. When done honestly, this allows for representation of minority groups of the population.  But it does mean that the sample is no longer random. For example, if you wanted to know how elementary-school teachers feel about a new dress code developed by the school district, a random sample may not include any male teachers, because there are so few of them. However, requiring that a certain number of male teachers be included in the sample insures that male teachers are represented — even though the sample is no longer random.

    Purposeful Sample: When it’s difficult to identify members of a population, researchers may include any member who is available. And when those already selected for the sample recommend other members, this is called a Snowball Sample. While this type is not random, it is a way to look at more invisible issues, including sexual assault and illness.

    Convenience Sample: When you’re looking for quick and dirty, a convenience sample is it. Remember when survey companies stalked folks at the mall? That’s a convenience or accidental sample. These depend on someone being at the right (wrong?) place at the right (wrong?) time. When people volunteer for a sample, that’s also a convenience sample.

    So whenever you’re looking at data, consider how the sample was formed. If the results look funny, it could be because the sample was off.

    On Monday, I’ll tackle sample size (something that I had hoped to include today, but didn’t get to). Meantime, if you have questions about how sampling is done, ask away!

  • One in a Million: How sample bias affects data

    One in a Million: How sample bias affects data

    Continuing with our review of basic math skills, let’s take a little look-see at statistics. This field is not only vast (and confusing for many folks) but also hugely important in our daily lives. Just about every single thing we do has some sort of relationship to statistics — from watching television to buying a car to supporting a political candidate to making medical decisions. Like it or not, stats rule our world. Unfortunately, trusting bad data can lead to big problems. 

    First some definitions. A population is the entire group that the researchers are interested in. So, if a school system wants to know parents’ attitudes about school starting times, the population would be all parents and caregivers with children who attend school in that district.

    sample is a subset of the population. It would be nice to track the viewing habits of every single television viewer, but that’s just not a realistic endeavor. So A.C. Nielsen Co. puts its set-top boxes in a sample of homes. The trick is to be sure that this sample is big enough (more on that Friday) and that its representative.  When samples don’t represent the larger population, the results aren’t worth a darn. Here’s an example:

    Ever hear of President Landon? There’s good reason for that. But on Halloween 1936, a Literary Digestpoll predicted that Gov. Alfred Landon of Kansas would defeat President Franklin Delano Roosevelt come November.

    And why not? The organization had come to this conclusion based on an enormous sample, mailing out 10 million sample ballots, asking recipients how they planned to vote. In fact, about 1 in 4 Americans had been asked to participate, with stunning results: the magazine predicted that Landon would win 57.1% of the popular vote and an electoral college margin of 370 to 161. The problem? This list was created using registers of telephone numbers, club membership rosters and magazine subscription lists.

    Remember, this was 1936, the height of the Great Depression and also long before telephones  and magazine subscriptions became common fixtures in most families. Literary Digest had sampled largely middle- and upper-class voters, which is not at all representative of the larger population.  At the same time, only 2.4 million people actually responded to the survey, just under 25 percent of the original sample size.

    On Election day, the American public delivered a scorching defeat to Gov. Landon, who won electoral college votes in Vermont and Maine only. This was also the death knell for Literary Digest, which folded a few years later.

    This example neatly describes two forms of sample bias: selection bias and nonresponse bias. Selection bias occurs when there is a flaw in the sample selection process. In order for a statistic to be trustworthy, the sample must be representative of the entire population. For example, conducting a survey of homeowners in one neighborhood cannot represent all homeowners in a city.

    Self-selection can also play a role in selection bias. If a poll, survey or study depends solely on participants volunteering on their own, the sample will not necessarily be representative of the entire population. There’s a certain amount of self-selection in any survey, poll or study. But there are ways to minimize the effects of this problem.

    Nonresponse bias is related to self-selection. It occurs when people choose not to respond, often because doing so is too difficult. For this reason, mailed surveys are not the best option.  In-person polling has the least risk of nonresponse bias, while telephone carries a slightly higher risk.

    If you’re familiar with information technology, you know the old adage: Garbage in, garbage out. This definitely holds true for statistics. And this is precisely why Mark Twain’s characterization of number crunching — “Lies, damned lies and statistics” — is so apropos. When the sample is bad, the results will be too, but that doesn’t stop some from unintentionally or intentionally misleading the public with bad stats. If you plan to make good decisions at any point in your everyday life, well, you’d better be able to cull the lies from the good samples.

    If you have questions about sample bias, please ask in the comments section. Meantime, here are the answers to last Wednesday’s practice with percentage change problems: –2%, 7%, –6%, –35%. Friday, we’ll talk about sample size, which (to me) is a magical idea. Really!