Categories
Math for Grownups Math for Writers

Statistics in reporting: When trend stories fail

Photo courtesy of apdik

Ah, the trend story — we love them and we hate them. Presumably, they tell us what’s hot or not, but they also overgeneralize with very few sources. Ask a room full of writers about trend stories, and you’re likely to see a few eyerolls. Here are some examples:

“Man buns” are in

Male college students seek sugar daddies to pay tuition bills

Female college students seek sugar daddies to pay tuition bills

Rich kids are taking private jets to summer camp

It’s not that these stories are inherently bad. In fact, they’re fascinating. The problem with trend stories is that too many readers, viewers and listeners take them to the next, not-so-logical step. These stories don’t mean that all men wear buns or that even a majority of men in Brooklyn wear buns. What they actually mean is that the reporter discovered a certain number of men in Brooklyn — plus a Top Chef contestent — wearing “man buns.”

That’s because words like majority or most or average actually have mathematical meanings. What’s more, I believe we count on these words to have real meaning, rather than serving as euphemisms for something that the reporter or editor saw a few times. Even using words like many or some isn’t a great way around this. These words cloud issues, rather than elucidate them.

Let’s look at an example. For a few years, sociologists, city planners and reporters have been talking about “food deserts.” These are geographic areas where residents have very few good options for grocery shopping. Because these are poorer regions, people tend to get their food from convenience stores or fast food restaurants, because they can’t drive or take public transportation to shop for fresh fruits and vegetables.

Sounds awful doesn’t it? For a few months, I saw dozens of stories on this phenomenon. But are food deserts ubiquitous? Or were these reports based on a few examples? Thing is, we can actually find out. (Check out the link to see for sure.)

That’s where statistics come in. And reporters don’t necessarily have to do the hard work of crunching these numbers. What is really important is the ability to interpret the data. And it’s critical to know about something called the Law of Large Numbers. [pullquote]The Law of Large Numbers says that the average of the results obtained from a large number of trials should be close to the expected value.[/pullquote]

In probability, performing the same experiment over and over again (and recording the results) is paramount. Otherwise, the data and conclusions just won’t mean much. The Law of Large Numbers says that the average of the results obtained from a large number of trials should be close to the expected value.

Without going into the nitty-gritty of the math, we can use the gist of the Law of Large Numbers to apply to trend stories. If you want to know whether food deserts are a real trend, you’d better locate more than three of them. If you want to say that they’re located in urban areas, you should check rural areas too. Because if your conclusion is based on only a handful of data, it’s not worth much.

And that’s not all. If you only look at data from a set with only certain characteristics, you can’t generalize your conclusion. It might be easy for those of us who live in cities to assume that food deserts are only in urban areas, right? Perhaps this is where trend stories are most likely to fail–when the writer or editor doesn’t consider life outside his personal bubble.

In other words, if you know three female college students who are financing their tuition with the help of “sugar daddies,” that doesn’t mean this is happening all over the U.S. You’d better get some more solid data than that, or you’re not being a responsible journalist.

And for all of you readers out there, look for these signs of a trend story gone awry: mostmanysome saycould be, etc. Enjoy the story, if you are so inclined, but don’t make the mistake of generalizing the anecdotes past exactly what has been reported.

In other words, a couple of guys in Brooklyn may be wearing man buns, but that doesn’t mean you (or a guy you know) won’t look out of place in your neck of the woods.

What are your favorite trend stories? Have you ever written a trend story that succeeded? If you’re a writer, what advice do you have for other writers for avoiding the trend-story trap?

Categories
Current Events Math for Grownups Math for Teachers Math for Writers

Political Reporting: The “math” of delegate votes

Photo courtesy of paulinaclemente

It’s been a weird primary season. Like an exciting Preakness race, the remaining Republican candidates are still going strong, and in some ways, the candidacy is way, way up in the air. Unlike previous primaries, we’re no closer to a Republican candidate than when we started this whole thing.

And now the political pundits and reporters are touting “delegate math,” with headlines like “It’s math vs. momentum as Romney, Santorum fight on” (Baltimore Sun) and “Romney’s Delegate Math Still Adds Up” (Wall Street Journal). See, when an election gets or stays tight, estimations won’t work any longer — especially as folks wonder when one of the candidates is going to drop out. It’s important to pull out the calculators or actually look up how many Republican delegates are in play in Illinois (69, if you’re actually curious).

But in all of my reading and listening, I haven’t gotten a good break-down of the delegate math that people keep talking about. I want to know which states Romney has to win in order to clinch the nomination. I want to know which states Santorum has to win to present a credible threat. In other words, how hard would it be for Santorum to pull out a win? What about Gingrich or Paul?

Fact is, math can help clarify these complex ideas — or not.

DISCLAIMER 1: This is as good a point as any to tell you that this is not a political blog. In my rough analysis, which will not be precise, I am not making any statements about whom I want to win the primary. I am not registered with either party, and my political beliefs (which I’ll keep to myself here) don’t play into this post. Of course, those who disagree with my numbers will probably think otherwise, as they are free to do.

DISCLAIMER 2: This post was written on Tuesday, March 20, before the Illinois primary, so those results are not included here — nor, for that matter, are any results in subsequent primaries.

DISCLAIMER 3: I am not a seasoned political journalist, and I’ve done the best I can with a mini crash course on Republican delegates. I’ve fact checked myself as best I can, but to be sure, these counts vary from source to source. If you think you have better numbers, by all means let me know in the comments section. (Just remember rule No. 1: be nice.)

Anywho…

I’ve done some research on this in the hopes I could break this code and give to you straight — while demonstrating that math is indeed useful in reporting, despite the countless journalism majors who have difficulty with liberal arts math. (That’s a joke, ya’ll. Don’t get mad.)

In the process, I discovered the reasons that these projections are impossible: 1) not all delegates have to vote the way their primaries go, 2) some states have winner-takes-all primaries, where the winner of the primary gets all of the delegates, but 3) other states have proportional primaries, where each candidate gets a proportion of the delegates based on the vote.

But there still must be a way for math to help me (and others) understand where we’re headed — even if it’s just a rough sketch — right? Let’s take a look.

There are 2,286 Republican delegates, and in order to win the nomination, a candidate must earn 1,144 delegate votes.  Here’s what the candidates have right now (according to The Green Papers, a website that makes it its business to track these delegate counts):

Romney: 407 (soft*) + 515 (hard*) = 922

Santorum: 170 (soft*) + 239 (hard*) = 409

Gingrich: 133 (soft*) + 157 (hard*) = 290

Paul: 26 (soft*) + 78 (hard*) = 104

*hard delegates are allocated votes and come super-delegate votes, while the soft delegates represent proportional votes, where the primary has been held and the proportional votes are estimated but not confirmed, or are uncertain super-delegate votes

So how many more delegates must each candidate earn before they can clinch the nomination (assuming that all of the soft delegate counts will become hard delegate counts)?

Romney: 1,144 – 922 = 222 delegates

Santorum: 1,144 – 409 = 735 delegates

Gingrich: 1,144 – 290 = 834 delegates

Paul: 1,144 – 104 = 1,040 delegates

See, to me these numbers tell a much clearer picture, but some additional comparisons would help. For example, what percent of the winning delegates does each candidate have, according to these numbers?

Romney: 922 ÷ 1,144 = 81%

Santorum: 409 ÷ 1,144 = 36%

Gingrich: 290 ÷ 1,144 = 25%

Paul: 104 ÷ 1,144 = 9%

(Notice, this doesn’t mean that Romney has earned 81% of the delegate votes. It means he’s earned 81% of the delegate votes he needs to come on top at the convention. And of course by earned, I mean these delegates have been identified as likely (or definitely, depending on the state) voting for Romney at the convention.)

For weeks, we’ve heard that Romney and Santorum are running neck-in-neck. But when you look at those percentages, well, they paint a different picture. Still there’s another number that I think would really help: the percentage of remaining delegates that each candidate must win.

Let’s assume (and this is a big assumption) that there are 1,725 delegates still up for grabs and (another big assumption) that all of the soft delegate counts will become hard delegate counts, just as they are noted here.  Then the candidates would need to win these percentages of the remaining votes in order to secure the nomination.

Romney: 222 ÷ 1,725 = 13%

Santorum: 735 ÷ 1,725 = 43%

Gingrich: 834 ÷ 1,725 = 48%

Paul: 1,040 ÷ 1,725 = 60%

There’s a huge difference between 13% and 43%. I’m not saying that it can’t be done. But with these numbers, this doesn’t look like a close race any longer.

I’m not saying that these are the be-all, end-all numbers that should be used to describe the Republican primary. But I am saying that math can help us understand where the candidates stand. And we absolutely should not depend on the candidates themselves to give us this analysis. Instead, journalists should be spending time with a pencil, paper and calculator (or a spreadsheet) — and some reliable sources — to figure these things out for their readers.

Any thoughts on how the math has been used in reporting this political race? Share them in the comments section.

Categories
Math at Work Monday Math for Writers

Math at Work Monday: Craig the writer

Welcome week three of our month devoted to publishing and media. If you haven’t previous posts, what’s stopping you? So far, we’ve looked at book publishing and on-air meteorology (television weatherpersons). This week, it’s time to look at writing. Today you’ll meet Craig Guillot, a freelance writer in New Orleans, who specializes in finance writing, among other things. Craig is the author of Stuff About Money: No BS Financial Advice for Regular People, an ebook, which he says will be available in April. (I’m a source for one section!)

Bottom line? Math helps keep Craig profitable. So if you’re a budding freelance writer–or looking for ways to leave more on your bottom line–listen up.

Can you explain what you do for a living?

I’m a non-fiction freelance writer. My specialties include business, personal finance, retail, real estate, travel and entertainment. I’ve written for publications and web sites, such as Entrepreneur, CNNMoney.com, Washington Post, Nationalgeographic.com and dozens of trade publications. I also have a personal finance book Stuff About Money: No BS Financial Advice for Regular People.

When do you use basic math in your job?

In the actual writing, not much. Just like any other writer or journalist, I interview sources, research, take trips out in the field, gather information and write. I occasionally do a little photography and video too. I do use math on occasion in some of my personal finance work to demonstrate and calculate different things related to retirement and investing.

But I use math a lot in the background. Writing just happens to be my trade. Like any other self-employed person, I am ultimately running a business. As a freelancer I sell my services to editors and corporate clients. I have a lot of regular clients, but I’m constantly taking on new projects and new deals. I need to be able to carefully estimate my time and expenses to give a client an accurate quote.

To me, everything is about the hourly rate. I need to use this as a basis for building my income. And while my overhead isn’t much, I do have to know what’s going out to pay taxes, what’s going into savings, retirement and everything else. It may seem like part of my personal life but I consider it all part of my job. When you’re self employed, you have to constantly think about all of these things.

Do you use any technology (like calculators or computers) to help with this math?

I’m not sure I even have a calculator in my office anymore, but my main tool is Excel. I use it for everything, and I mean everything. It’s a calculator but so much more. There is no problem that can’t be solved, no analysis that can’t be made, in Excel. When you learn how to use it and how to write the formulas you need, you can do anything with it. I use it to analyze my revenues, analyze the profitability of certain assignments. Like everyone else, I use Quickbooks, but I also use Excel for background stuff.

I break everything down to a formula or percentage. This includes my monthly income goals. It doesn’t have to be that way. I don’t imagine it’s that way for many other writers but it works for me and helps me make the optimal decisions. I’ve used Excel to track, analyze and compute things in my regular life as well. I used it in the remodeling of our house, in tracking my net worth, in monitoring my investments, planning retirement, planning trips. I sit down, make up a spreadsheet, build some formulas, input the data and then use it to help make decisions. I run marathons and even use it to track my training runs and races. The more you learn how to use Excel and write formulas, the more uses you find for it.

How do you think math helps you do your job better?

One way it helps me is with analyzing my hourly rate and profitability. Whenever I take on special projects for a corporate client or a custom publisher, I use it to give a quote. I prefer to work on a project rate. I give them a single number but behind that is a lot of math that I have used to arrive at that number. They don’t need to know any of that.

I may also build in a variance. It will let me know if I might be able to live with a cut in that number. So if they want to try to negotiate that down a bit, I know that I can drop by 5%, 7%, 10% or whatever it might be for me to still make what I need to make.

I also need to factor in opportunity cost. That is what else I could be doing with my time. Do I take this project which will tie me up for three weeks or do I decline it and go after smaller but potentially more lucrative projects that will make my time more flexible? I use math to figure all this out.

How comfortable with math do you feel?

In relation to personal finance and business math, I feel very comfortable with it because I use it so much and see the value in it. But all the standard stuff you learn in school? I really don’t remember any of that. I’d have to pull out a book and look up some formulas if you wanted me to calculate cubic volume or something like that.

What kind of math did you take in high school?  Did you like it/feel like you were good at it?

Just the basics. Algebra, geometry, standard high school stuff. I wasn’t particularly good at it, I was just average. But I majored in business in college and took a lot of accounting, finance and business math classes. I always excelled at those and had a stronger interest in them. Math dealing with money just felt real to me. There was an instant connection of “Oh, I could actually use this someday.”

Did you have to learn new skills in order to do the math you use in your job? Or was it something that you could pick up using the skills you learned in school?

I did pick up some new skills, but a lot of the business and personal finance math I used today can be traced right back to college. The fact that I actually enjoy this kind of math really helps.

Anything else you want to mention?

Yes. I believe that many of our growing financial problems in this country—like people getting into mortgages they couldn’t afford, our lack of savings, our failure to put enough money away for retirement, our problems with credit card debt—can be traced partly to our failure to use math in our financial lives. People buy homes and cars on emotion but rarely run the numbers. They wouldn’t use debt to overspend if they really knew the long-term consequences. There is a numerical answer for everything in your finances. You have to know why that number is important, how to calculate it and how to use it.

Any questions for Craig? I’m sure he’d be happy to answer them!

Categories
Current Events Math for Grownups Math for Parents Math for Teachers Math for Writers

Using Math to Predict Hurricanes

Okay, I’ll admit it. I don’t typically watch television news. (Sorry Tony!) But when bad weather comes along,  seeing those weather maps is often exactly what I’m looking for.

I lived in a hurricane prone area for 15 years, weathering (eh-hem) many a storm and getting through some close misses. When you see that many big storms, you get used to the terminology (like storm surge) and develop a false confidence in your own ability to predict what’s coming.

But as you know, a gut feeling isn’t enough. In fact, meteorologists use a complex system of previous data and what they know about how these storms act to make predictions. What they’re saying, though, is that there is a chance something will happen. And what is that based on? Probability and statistics.

Categories
Math for Grownups Math for Parents Math for Teachers

Belated Pi Day Celebration

You know when you were little and you got sick on your birthday? It’s not quite the same thing, but I was down and out yesterday — on Pi Day! (I didn’t even get to wear my “cool” Pi sweatshirt.) So I bring you these little tidbits a day late.

What’s Pi Day, you ask? Flip back to yesterday’s calendar: March 14 or 3-14. Now think about the estimation of π or pi: 3.14. Ta-da!

Here are a few ways folks have celebrated Pi Day, thanks to the watchful eyes of my wonderful Math for Grownups readers.

Amherst College, 2004: “On March 14, or 3.14, students celebrated National Pi day by waking up at 6 a.m. and burning through 15 sticks of sidewalk chalk. Here, digits of pi trail off in front of Fayerweather Hall on National Pi Day. 2,010 digits of pi stretched from Valentine Dining Hall to Merrill Science Center.”

Photo courtesy of Amherst College website

Are Shakespeare’s Plays Encoded With Pi? Vi Hart strikes again. (And yes, it’s in iambic pentameter. Genius!)

3.14 ways to celebrate Pi Day, from Carol Pinchefsky at Forbes.com. 

Sand Art Video: If you’re a child of the 80s (like I am) or just love Tommy Tutone, click on this.

Oh, and what does my π sweatshirt look like? It says: Now I need a verse recalling pi. Can you figure it out?

Did you celebrate Pi Day? Tell us what you did in the comments section.

Categories
Math at Work Monday

Math at Work Monday: Tony the on-air meteorologist

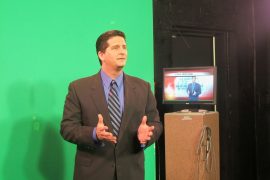
Quick! What do you have to know before changing from your jammies into something a little more work appropriate? The weather, right? Tony Pann is an on-air meteorologist for WBAL-TV 11 in Baltimore, Maryland. Math helps him predict if there are sunny skies ahead or if you’ll need to pack your umbrella. Here’s how.

Can you explain what you do for a living?

I have been a television meteorologist for 22 years. Since 2009, I’ve been working as part of the morning team at WBAL TV.

When do you use basic math in your job?

I use math everyday! The computer models that we use to forecast the weather, are based on very complicated formulas derived from fluid dynamics. The atmosphere acts very much like a body of water, so the same mathematics can be applied to both. Each day, over a dozen different computer models are run predicting the state of the atmosphere at different time frames. An initial set of data is entered at a specific starting time, then the model shows us it’s interpretation of what the state of the atmosphere will be at certain time intervals. For example, the data might be entered at 7 a.m., then the model will predict the temperature, wind speed, and barometric pressure at 10 a.m., 1 p.m. and 4 p.m. Some of these models are short range, and only extend out to 48 hours, while others go all the way out to 365 hours from the starting point!

So let’s say there are 13 models that do this same thing each and every day, two or three times a day. It’s my job as a meteorologist to interpret all of that data, and translate it into the very understandable and reliable seven-day forecast that you see on TV. With so much data out there, the intuition and experience of the forecaster is very important. Since each model takes in the same starting data, but is run on a different formula, they all come up with different answers. For example, one model might say the high temp for today is going to be 45 and another could say 50. Or one could predict 6 inches of snow and the other says 1 inch. It’s my job to decide which one is right and why.

Sometimes I don’t trust any of them, and I’ll do a quick calculation on my own.  Here’s an equationthat I can use to calculate the high temp for the day by hand:

T_max =  (Tk_{1000 – 850}*0.36)-422

where T_max is the potential high temperature and Tk_{1000-850} is the 1000mb to 850mb thickness in meters.

I then go on TV, and try and explain it all in an interesting manor — at least that’s the goal.

Did you have to learn new skills in order to do the math you use in your job? 

In order to get a degree in meteorology, you actually have to learn all of the math that the computers are doing to give us those answers. It’s not easy! By the time we are finished, we’re just a class or two short of having a minor in mathematics. It’s great to know what the computers are doing, but I’m glad we don’t have to work it out by hand anymore. If not for the wonderful training in the world of mathematics, I most certainly would not be doing this job.

Do you have questions for Tony? Ask them in the comments section, and I’ll let him know to peek in!

Categories
Math for Writers

Royalty Math: How many books will you have to sell?

Photo courtesy of Jain Basil Aliyas

So let’s say you got a book deal. Yay! Have that glass of wine or virgin daiquiri — and then it’s time to get down to business. How much can you actually earn from this venture?

If you’re new to publishing, you may not know how you’ll earn a check from a book deal. With the advent of self-publishing and ebooks, there are many different models. Still, many publishers depend on the tried and true advance-royalty model. But how does this work?

First the writer gets an advance. This is a lump sum — sometimes paid in installments — that is paid to the writer before the book is published. This figure can vary widely, from $0 to a seven-figure value. It’s based on the author’s expertise, reader demand and expected sales. That means J.K. Rowling is going to earn a higher advance than a funny, charming math geek.

The advance is exactly what it sounds like — an upfront fee based on what the publisher thinks the book will earn. So you’ll get paid for your time writing the book, even though the publisher isn’t earning anything yet.

Royalties are what you’ll earn from the book sales — usually a percent of the price of the book. But there are lots of things to consider here, like how much a bookstore actually pays for the book.

Here’s the catch: you’ll need to earn out your advance, before you start getting royalties. In other words, you won’t see a dime from your publisher until after your royalties equal the advance you were paid. (And sadly, some books never do this.)

Whew! And you thought all you’d have to do is write the darned thing!

Any experienced writer will warn you: read your contract carefully before signing. I’ll go one step further: do the math. (Surprise!)

What you want to know is the number of books you have to sell before you actually earn some cash. If that number is in the stratsophere — or your advance is really low — you may want to shop around. (Then again, there’s something to be said for taking a risk or enjoying a labor of love.)

Mathematically speaking, there are several variables: the amount of your advance, price of the book, royalty percent and the number of books you’ll need to sell to earn out. The advance, book price and royalty percent are set. What you need to know is the number of books you need to sell.  Let’s look at a simple example:

June has been shopping around Physics for Grownups for several years. She’s convinced that she has a great idea, if she can only find the right publisher. Lo and behold, on her 17th try, she finds a publisher who is interested. The contract offers a $5,000 advance and 5% royalty. The book is priced at $12.99.

Is this a good deal?

June is no dummy. She knows that a physics book isn’t likely to be a best seller. Still, she doesn’t want to spend weeks and weeks writing if she’s not likely to see any profit. Based on the contract, how many books would she need to sell to earn out her advance?

She will earn 5% on each $12.99 book. (That’s assuming that all books are purchased at the cover price.)

$12.99 x 0.05 = $0.65

In other words, June will earn $0.65 per book. To find out her break-even point, she needs to divide her advance by the amount she’ll earn per book:

$5,000 ÷ $0.65 = 7592.3

So, June will need to sell 7,593 books before she will even get a royalty check. That’s a lot of books.

Only June can decide if this is worth it. Some books are like tortoises — they make slow and steady progress, while other books are flashes in the pan. If June plays her cards right, she could do just fine over a long period of time. The math can only give her the cold, hard details.

Have you published a book? If so, what went into your decision to take the leap? Did you do the math or just decide it was worth it regardless? Share your ideas in the comments section.

Categories
Math for Writers

Overwhelming Word Count? Use math to motivate

November 2011, I knew I had my work cut out for me.  First off, I had never written a book before.  Writing 800-word stories paled in comparison to the 55,000 words I was expected to produce for this book.  Second, I had only 8 weeks to pull off this gargantuan task — and right smack dab in the middle of them were the winter holidays: Christmas, Hanukkah, Winter Solstice and New Years.

Looking back, I think I must have been insane.

But this book wasn’t just any old book. I knew I could crank out the ideas, because they’d been sitting in my head for years and years.  Still, I was nervous.

So what did I do? Well, I turned to my old friend math, of course.

I knew I was probably going to write chapter by chapter. But how many words should each chapter be?  I was contracted to write 10 chapters, plus an introduction.  I also wanted to include a glossary and an appendix with formulas.  Just as a starting point, I figured the introduction, glossary and appendix would be about the same length as one chapter.  So that meant I was dividing the entire word count by 11.

55,000 words ÷ 11 chapters = 5,000 words/chapter

Each chapter needed to be about 5,000 words long.  Convenient, eh? Suddenly those 55,000 words were simply 11 5,000-word “stories.” I’d written 6,000-word stories before, so I knew I could manage this!

Then I had to look at my timeline: 8 weeks.  I didn’t want to write during the week of the Christmas holiday, so I really had only 7 weeks.  But one chapter was pretty much done, since I had to turn it in with my proposal.

Clearly, I couldn’t write one chapter each week.  With 11 “chapters” (if I considered my introduction, glossary and appendix as a chapter), I was going to need to double up.  I had already planned to work 7 days a week, if necessary, so I did some more math to figure out the total number of days I’d be writing the ten remaining chapters.

7 weeks x 7 days = 49 days

And a little more math to figure out the number of days I had to write each chapter.

49 days ÷ 10 chapters = 4.9 days/chapter

To be realistic, I decided to bet on 4 days per chapter.  That would give me a couple of days off here and there.

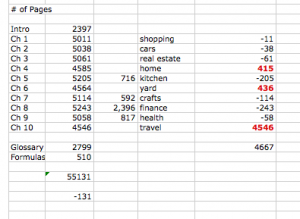
I did fine with this plan, until mid-December. I slowed down considerably, and by the start of 2011, I was behind. Panic set in.  So I turned to math yet again. This time, I pulled out the big guns: a spreadsheet.

This is an actual screenshot of my book spreadsheet.

I don’t have a screenshot of what my book spreadsheet looked like originally.  The above is how it ended up.  But I can tell you this: when I was really feeling nervous about my progress, I checked my word count and updated my spreadsheet — sometimes several times in an hour — just to see the numbers change.

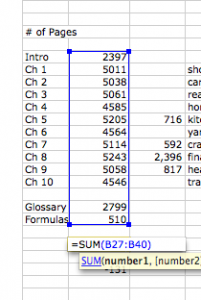
You see, in some of the fields are formulas that add or subtract to show my word count.  Here’s an example:

I used the SUM function to add up everything in the blue box — in other words, my actual word count for each chapter. When I changed a value in the blue box, the total pages changed as well. Here’s another example:

Here, I’ve subtracted the word count for the chapter on yard work from 5,000 (or my estimate word count for each chapter). Each time I updated my word count for that chapter, the difference changed.

Yeah, this is really, really geeky, I’ll grant you that! And I know it takes a “special” brain to love spreadsheets this much. But I do think it’s an effective way to set goals and get yourself motivated.

So if you’re worried about how you’ll ever finish writing that book or make all of those quilt squares or whatever your big project is, consider how math can help. It just might get you organized enough to get started. (Or it might give you the distraction you need to settle your nerves.)

When have you used math to help you get through a daunting project?  Share your story in the comments section!

Categories
Math at Work Monday Math for Writers

Math at Work Monday: Jennifer the book editor

Photo courtesy of shutterhacks

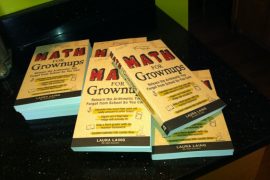
So you’ve got a brand new book on your nightstand or electronic reader. Or maybe you have a book idea that you’d love to get published. How on earth does an idea get translated to pages or bytes? A book editor could play a big role. Jennifer Lawler was my editor for Math for Grownups, and these days, she’s the imprint manager for Adams Media’s new direct-to-ebook romance imprint. Today, she answers the big question we have here on Mondays: How do you use math in your job?

Can you explain what you do for a living?

I’m an imprint manager for a book publishing company, which means I acquire books from writers based on what we think our readers will want to read. Then I shepherd the books through the entire editorial and production process, which includes everything from negotiating contracts to approving cover design to making sure the publicity department is doing its job. My job constantly switches from big-picture items like “How  does our imprint differentiate itself from other imprints like it?” to nitty-gritty items like “did that copy editor ever send over her invoice?”

When do you use basic math in your job?

I have a set budget for producing each title, but not all titles are alike, so they require different amounts of money. I have to make sure that each book gets what it needs without going over the budget as a whole, and also without being really out of whack for any one title. This is very similar to keeping a household budget and balancing a checkbook.

For nonfiction print books, I have to calculate how to make them fit into the allotted page count we have for them. At my company, page count is determined at the time a book is signed, based on the type of book it is, what the cover price will be, and other factors. Since nonfiction books are sold on proposal, not finished product, the finished product can vary significantly from what we assumed it would be at the time of signing. So I have to figure out what we can do to make the book fit. Can we add pages to the index, or subtract pages from the index? Can we add or subtract front matter? Can we go up to 2-page chapter openers or down to 1-page part openers? We can’t go over or under more than 16 pages for any project. Usually it’s not a big problem but sometimes you should see my desperation!

Do you use any technology to help with this math?

We use a special calculator based on trim size to estimate how many words per page, taking design considerations into account (lots of sidebars or illustrations mean fewer words on each page). For the budget, I just use a spreadsheet. This just helps make sure simple errors in addition or subtraction don’t through the whole process off.

How do you think math helps you do your job better?

On a fundamental level, if I don’t do the math right, the company and everyone in it suffers. We miss our projections, we overrun our budgets, we even screw up our earnings. That’s a big deal. It also helps me be creative and to make better judgment calls. If I find myself saying, “Well, it doesn’t really matter if this one book doesn’t fit the page count, I can just get the publisher to change the page count,” I know I’m being lazy. Maybe that is what has to happen sometimes, but that type of change directly impacts our profit-and-loss statement for the title, so it has to be the last resort. Same with the budget. “Well, the publisher isn’t going to kill me if I go over by a little bit.” That’s true, but it’s a lazy way of thinking. Doing the math makes me think about what I need to do differently to hit the budget. In some instances, yes, the budget simply needs to be bigger. But it could mean I need to watch what I acquire so I’m not picking up things with potential but that require a ton of editing. It could mean I need to streamline a process somewhere or develop a template instead of doing some type of custom approach each time.

Math adds a lot of clarity to my work—something I never thought a book editor would say!

How comfortable with math do you feel?

I am pretty comfortable with math except when I am put on the spot (like someone asking me point-blank to answer a math question). I find the math at work to be easy in the sense that I’m confident about not making mistakes with it. I do it in the privacy of my office, so if I have to check my calculations five different times to make sure I’ve got them right, I do it.

What kind of math did you take in high school?

I got as far as Algebra II and felt like a complete idiot by that point.

Did you have to learn new skills in order to do the math you use in your job?

I had to get over my fear of “oh my god I will screw up the math and they’ll kick me out and I love this job!” Other than that, though, the math is straightforward—definitely something a high-school kid could do. Probably a third-grader could do it

Thanks for playing with us today, Jennifer!  If any of you dear readers are interested in writing and publishing a book, check out Jennifer’s great book proposal class.  (I can recommend it from personal experience!) Or feel free to ask her a question in the comments section.

Categories
Math for Writers

Welcome March! Media, publishing and math

Sometimes information comes in these big, boring stacks — and without the coffee. Media professionals crunch it, so you don’t have to. (Photo courtesy of misspudding)

In 1998, I landed my first real media job — as a content producer at PilotOnline and HamptonRoads.com, websites for The Virginian-Pilot, a daily newspaper in Norfolk, Va. My first assignment was to develop and launch a schools section, featuring interactive content like a lesson plan database, information about local schools and the results of statewide test scores.

Each year, I’d get notice that the Standards of Learning test scores were about to be released. I’d have three days to download the data, organize it into a database and then output it on the site. When the information went live, visitors could look up their school and see results in a variety of subject areas. They could even answer sample questions to see how they would fare.

I had a blast. Seriously.

For the first time in my career, I was combining my degree (math) with my passion (journalism). And it was fun.

Fact is, there’s lots and lots of math in publishing and media. But every single day, some poor English major is shocked to find out that he needs to add, subtract, multiply, divide or — oh my! — even employ an equation or two in order to do his job well.

But math and media go together like the Pope and his funny hat. Math helps readers understand complex information, and it helps writers and producers create content that people want to read or watch or listen to. Math helps publishers save money. Math helps readers scan the newspaper over a bowl of Cheerios — and get the gist of the story.

Here are some examples:

1. Instead of publishing the entire Census results, a newspaper crunches the numbers and creates colorful charts that are easy to read and understand.

2. Meteorologists don’t guess the weather forecast; they review previous data and apply what they know about weather to predict when we’re about to be hit with 17 inches of snow.

3.  When you read a book, the text is arranged so that the number of pages is divisible by four — and you’re not skipping over blank pages.

4. A website will average the starred reviews of a movie so that you don’t have to read each and every reviewers opinion.

And then there are the countless examples that most readers, viewers and listeners aren’t even aware of.

Here at Math for Grownups, March is devoted to publishing and media. Throughout the month, you’ll meet folks in these industries and learn how they use math in their jobs: like Jennifer Lawler, who is an imprint manager for my publisher, Adams Media, and Tony Pann, on-air meteorologist at WBAL-TV. And of course we’ll delve into a variety of topics — from making graphs to critically analyzing a reporter’s numbers.

Whether you’re a writer or broadcaster or just a consumer of media, make sure you come back this month. You just might learn something — or discover that you use math all the time.

Is there a topic you’d like me to cover this month? If so, drop me a line, and I’ll see what I can do. Or just post a comment with your suggestions.

Categories
Art Math for Grownups Math for Teachers Math for Writers

Histograms: Illustrations of variance

Photo courtesy of potzuyoko

In our interview on Monday, professional photographer Sally Wiener Grotta talked about using histograms to help determine the exposure she needs to best reflect her subject in a photograph. If you took any statistics in high school or college — or have helped a middle schooler with her math homework — you may know exactly what a histogram is. But do you understand how these graphs are helpful for photography?

In short, a histogram is a graph that demonstrates variance and frequency.  (Stay with me here. I know there are some strange, mathy words in there.) Here’s a really simple example:

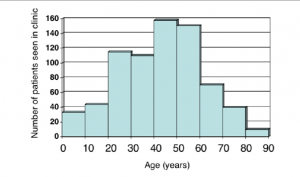
The administrators of a health clinic are collecting data about the patients, so that they can provide the most appropriate services.  The histogram below shows the ages of the patients.

Even with one quick glance, it’s apparent that the clinic sees far fewer patients who are between 80 and 90 years old. In fact, it looks like the group that’s most represented includes those between 40 and 50 years old.

(If you’re really being a smarty pants, you might notice that the histogram follows the normal or bell curve. But you don’t have to know that to get along in everyday life — unless you work in statistical analysis.)

So here’s what’s special about a histogram:

1. The horizontal line (or axis) represents the categories (or bins). These are almost always numbers, and each one has no gaps. In other words, in a histogram, you won’t have categorical data, like people’s names. Notice also that the data is continuous. Someone who is 43 and 5 months falls in the 40-50 year old category.

2. The vertical line (or axis) represents the frequency or count of each category.  These are always numbers. So in the histogram above, 40 people who visited the clinic were between 80 and 90 years old.

3.  The bars of the histogram butt up against one another. That demonstrates the fact that there are no gaps in the data and the data is numerical.

4. The taller the bar, the more values there are in that category. The shorter the bar, the fewer values there are in that category.

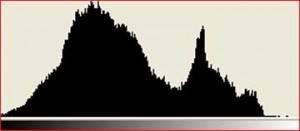
So let’s look at a photographer’s histogram:

First off, these histograms are automatically generated by imaging software or even some fancy-schmancy cameras. In other words, technology plots these values. It’s the photographer’s job to interpret them.

You probably noticed that there are no numbers on this histogram.  Like a statistical histogram, the vertical axis represents frequency.  But the horizontal axis doesn’t represent numbers. Instead, it shows shades.  Follow the bar at the bottom of the histogram from the left to the right.  Notice how it goes from black to grey to white? In fact, the bar gradually changes from black to white.

If you could blow up this histogram to a much larger size, you would see that it’s made up of lots and lots of skinny rectangles. These represent the number of pixels in the photograph that are each shade. So there are very few (if any) pure white pixels. There are some pure black pixels, but not as many as there are grey ones.

By glancing at this image, an experienced photographer can determine whether an image needs more or less exposure. There’s a great deal of artistry in this — a really dark photo can have a dramatic effect, while certain conditions require more exposure than others.

There you have it. Histograms aren’t just for statisticians. And those silly little graphs you drew in your middle school math class actually have artistic value!

Do you have questions about histograms? Ask them in the comments section!

Categories
Math at Work Monday

Math at Work Monday: Sally the photographer

Photography is one of those art forms that looks easy but is really challenging — at least challenging to get it done right!  Writer and photojournalist, Sally Wiener Grotta describes how math helps her compose the best photograph, including perfect lighting. 

Can you explain what you do for a living?

Essentially, I am a visual and verbal storyteller. This has developed into a multi-pronged career.

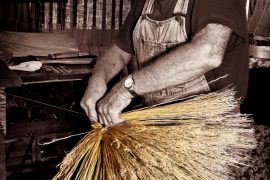
As a photojournalist, I have traveled all over the globe, visiting all 7 continents (including Antarctica several times) and many islands (such as Papua New Guinea and Madagascar) on assignment for major magazines and other publications. My current and ongoing fine art project is American Hands (www.facebook.com/AmericanHands) for which I am creating narrative portraits of individuals who are keeping the old trades alive, such as a blacksmith, glassblower, bookbinder, spinner, weaver, etc.  I travel around the county, mounting American Hands exhibits and giving presentations about the people I photograph.

In addition, I give lectures and teach master classes on photography and imaging. I recently launched a YouTube channel in which fellow photographer David Saffir and I discuss the essential elements that define a photograph and pull us into it, using the narrative power of shadow and light.

As a non-fiction writer, I have written literally thousands of articles, columns, features and reviews for major magazines, newspapers and websites, as well as seven non-fiction books. In non-fiction, I am primarily known for my expertise in testing, analyzing and explaining technology related to photography, imaging, printing and epublishing.

My first novel “Jo Joe” will be published this spring as both an eBook and printed book by Pixel Hall Press, followed later this year with other stories and books.

When do you use basic math in your job?

Math is integral to my work in many ways. An intuitive understanding of geometry is essential for good photographic composition. In addition, I use math to control exposure (the amount of light used to define a photograph) and to decide how to set up auxiliary lighting.

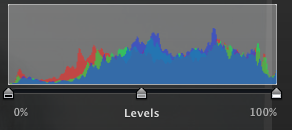
A prime example of math in photography and imaging is the histogram tool. The histogram is a graph that provides information analyzing the exposure of a photograph. When a photographer or digital artist looks at a histogram, it helps us understand the “dynamic range” of the picture. In other words, what percentage of the photograph is made up of highlights, shadows and midtones. If the graph displays that there is too much image data in, say, the highlights, and I know that the image is of a scene that isn’t that bright, I can then decide to change my exposure so the photo better represents the scene.

But basic math goes much deeper into my everyday career concerns. For instance, my American Hands project is a non-profit venture supported by grants and sponsors. When I apply for a grant, I must present an accurate, logical and meaningful balanced budget. Therefore, I have to calculate my costs over time and balance that against potential income. (If the budget isn’t balanced with income=costs, the grant application will be rejected.)

Another example of everyday math has to do with laying out books and journals for publication, such as my American Hands Journal. At the very basic, a typical book is printed in “signatures” of a specific number of pages each, such as 4-pages each. So a book must be laid out so that its total pages are a multiple of 4 (or whatever the signature number is). Then, there are spatial concerns, such as keeping type and photographs within specific printable margins, that requires more intuitive understanding of geometry.

Do you use any technology to help with this math?

I do believe that it is important to understand math and be able to do it without calculators or computers. However, when I use it for accounting, grants applications and such, I must be sure that I haven’t introduced an error, through a mistake in arithmetic or simply a typo. So, I may use a calculator. More often, I will use Microsoft Excel on my computer to create a spreadsheet that does automatic calculations for me when I input figures. However, I am the one who creates the rules for those calculations. So, using a spreadsheet doesn’t preclude the need to understand the underlying math.

How do you think math helps you do your job better?

Math isn’t only necessary in my career as an artist and writer, but it is also a skill that sharpens your mind the more you use it. That kind of precision thinking is a great complement to the creative side of my business, balancing it. What’s more, a sharpened mind is one that is more open and creative.

How comfortable with math do you feel?

I was lucky to have some wonderful teachers – starting with my mother before I ever went to school. She created basic arithmetic puzzles to keep me busy, and I learned to think of numbers as a game, starting when I was about 4 years old. So, I have long been comfortable with numbers and their relationships to each other. Math and art are not opposites. In fact, in the Renaissance, the great mathematicians were artists and vice versa. And, today, the great math innovators have highly creative minds.

What kind of math did you take in high school?

I studied geometry, algebra and calculus in high school.  I enjoyed it, again, mostly because I had good teachers. It continued to be a game to me to understand how numbers fit and changed each other.

Did you have to learn new skills in order to do the math you use in your job?

The new skills I developed since leaving school has to do with defining intelligent, useful calculation rules in an Excel spreadsheet. But it was all based on math I already understood, so it was relatively easy… once I understood how the spreadsheet works.

Do you have questions for Sally?  Ask them in the comments section!