Okay, I’ll admit it. I don’t typically watch television news. (Sorry Tony!) But when bad weather comes along, seeing those weather maps is often exactly what I’m looking for.
I lived in a hurricane prone area for 15 years, weathering (eh-hem) many a storm and getting through some close misses. When you see that many big storms, you get used to the terminology (like storm surge) and develop a false confidence in your own ability to predict what’s coming.
But as you know, a gut feeling isn’t enough. In fact, meteorologists use a complex system of previous data and what they know about how these storms act to make predictions. What they’re saying, though, is that there is a chance something will happen. And what is that based on? Probability and statistics.
So let’s say you got a book deal. Yay! Have that glass of wine or virgin daiquiri — and then it’s time to get down to business. How much can you actually earn from this venture?
If you’re new to publishing, you may not know how you’ll earn a check from a book deal. With the advent of self-publishing and ebooks, there are many different models. Still, many publishers depend on the tried and true advance-royalty model. But how does this work?
First the writer gets an advance. This is a lump sum — sometimes paid in installments — that is paid to the writer before the book is published. This figure can vary widely, from $0 to a seven-figure value. It’s based on the author’s expertise, reader demand and expected sales. That means J.K. Rowling is going to earn a higher advance than a funny, charming math geek.
The advance is exactly what it sounds like — an upfront fee based on what the publisher thinks the book will earn. So you’ll get paid for your time writing the book, even though the publisher isn’t earning anything yet.
Royalties are what you’ll earn from the book sales — usually a percent of the price of the book. But there are lots of things to consider here, like how much a bookstore actually pays for the book.
Here’s the catch: you’ll need to earn out your advance, before you start getting royalties. In other words, you won’t see a dime from your publisher until after your royalties equal the advance you were paid. (And sadly, some books never do this.)
Whew! And you thought all you’d have to do is write the darned thing!
Any experienced writer will warn you: read your contract carefully before signing. I’ll go one step further: do the math. (Surprise!)
What you want to know is the number of books you have to sell before you actually earn some cash. If that number is in the stratsophere — or your advance is really low — you may want to shop around. (Then again, there’s something to be said for taking a risk or enjoying a labor of love.)
Mathematically speaking, there are several variables: the amount of your advance, price of the book, royalty percent and the number of books you’ll need to sell to earn out. The advance, book price and royalty percent are set. What you need to know is the number of books you need to sell. Let’s look at a simple example:
June has been shopping around Physics for Grownups for several years. She’s convinced that she has a great idea, if she can only find the right publisher. Lo and behold, on her 17th try, she finds a publisher who is interested. The contract offers a $5,000 advance and 5% royalty. The book is priced at $12.99.
Is this a good deal?
June is no dummy. She knows that a physics book isn’t likely to be a best seller. Still, she doesn’t want to spend weeks and weeks writing if she’s not likely to see any profit. Based on the contract, how many books would she need to sell to earn out her advance?
She will earn 5% on each $12.99 book. (That’s assuming that all books are purchased at the cover price.)
$12.99 x 0.05 = $0.65
In other words, June will earn $0.65 per book. To find out her break-even point, she needs to divide her advance by the amount she’ll earn per book:
$5,000 ÷ $0.65 = 7592.3
So, June will need to sell 7,593 books before she will even get a royalty check. That’s a lot of books.
Only June can decide if this is worth it. Some books are like tortoises — they make slow and steady progress, while other books are flashes in the pan. If June plays her cards right, she could do just fine over a long period of time. The math can only give her the cold, hard details.
Have you published a book? If so, what went into your decision to take the leap? Did you do the math or just decide it was worth it regardless? Share your ideas in the comments section.
November 2011, I knew I had my work cut out for me. First off, I had never written a book before. Writing 800-word stories paled in comparison to the 55,000 words I was expected to produce for this book. Second, I had only 8 weeks to pull off this gargantuan task — and right smack dab in the middle of them were the winter holidays: Christmas, Hanukkah, Winter Solstice and New Years.
Looking back, I think I must have been insane.
But this book wasn’t just any old book. I knew I could crank out the ideas, because they’d been sitting in my head for years and years. Still, I was nervous.
So what did I do? Well, I turned to my old friend math, of course.
I knew I was probably going to write chapter by chapter. But how many words should each chapter be? I was contracted to write 10 chapters, plus an introduction. I also wanted to include a glossary and an appendix with formulas. Just as a starting point, I figured the introduction, glossary and appendix would be about the same length as one chapter. So that meant I was dividing the entire word count by 11.
55,000 words ÷ 11 chapters = 5,000 words/chapter
Each chapter needed to be about 5,000 words long. Convenient, eh? Suddenly those 55,000 words were simply 11 5,000-word “stories.” I’d written 6,000-word stories before, so I knew I could manage this!
Then I had to look at my timeline: 8 weeks. I didn’t want to write during the week of the Christmas holiday, so I really had only 7 weeks. But one chapter was pretty much done, since I had to turn it in with my proposal.
Clearly, I couldn’t write one chapter each week. With 11 “chapters” (if I considered my introduction, glossary and appendix as a chapter), I was going to need to double up. I had already planned to work 7 days a week, if necessary, so I did some more math to figure out the total number of days I’d be writing the ten remaining chapters.
7 weeks x 7 days = 49 days
And a little more math to figure out the number of days I had to write each chapter.
49 days ÷ 10 chapters = 4.9 days/chapter
To be realistic, I decided to bet on 4 days per chapter. That would give me a couple of days off here and there.
I did fine with this plan, until mid-December. I slowed down considerably, and by the start of 2011, I was behind. Panic set in. So I turned to math yet again. This time, I pulled out the big guns: a spreadsheet.
This is an actual screenshot of my book spreadsheet.
I don’t have a screenshot of what my book spreadsheet looked like originally. The above is how it ended up. But I can tell you this: when I was really feeling nervous about my progress, I checked my word count and updated my spreadsheet — sometimes several times in an hour — just to see the numbers change.
You see, in some of the fields are formulas that add or subtract to show my word count. Here’s an example:
I used the SUM function to add up everything in the blue box — in other words, my actual word count for each chapter. When I changed a value in the blue box, the total pages changed as well. Here’s another example:
Here, I’ve subtracted the word count for the chapter on yard work from 5,000 (or my estimate word count for each chapter). Each time I updated my word count for that chapter, the difference changed.
Yeah, this is really, really geeky, I’ll grant you that! And I know it takes a “special” brain to love spreadsheets this much. But I do think it’s an effective way to set goals and get yourself motivated.
So if you’re worried about how you’ll ever finish writing that book or make all of those quilt squares or whatever your big project is, consider how math can help. It just might get you organized enough to get started. (Or it might give you the distraction you need to settle your nerves.)
When have you used math to help you get through a daunting project? Share your story in the comments section!
So you’ve got a brand new book on your nightstand or electronic reader. Or maybe you have a book idea that you’d love to get published. How on earth does an idea get translated to pages or bytes? A book editor could play a big role. Jennifer Lawler was my editor for Math for Grownups, and these days, she’s the imprint manager for Adams Media’s new direct-to-ebook romance imprint. Today, she answers the big question we have here on Mondays: How do you use math in your job?
Can you explain what you do for a living?
I’m an imprint manager for a book publishing company, which means I acquire books from writers based on what we think our readers will want to read. Then I shepherd the books through the entire editorial and production process, which includes everything from negotiating contracts to approving cover design to making sure the publicity department is doing its job. My job constantly switches from big-picture items like “How does our imprint differentiate itself from other imprints like it?” to nitty-gritty items like “did that copy editor ever send over her invoice?”
When do you use basic math in your job?
I have a set budget for producing each title, but not all titles are alike, so they require different amounts of money. I have to make sure that each book gets what it needs without going over the budget as a whole, and also without being really out of whack for any one title. This is very similar to keeping a household budget and balancing a checkbook.
For nonfiction print books, I have to calculate how to make them fit into the allotted page count we have for them. At my company, page count is determined at the time a book is signed, based on the type of book it is, what the cover price will be, and other factors. Since nonfiction books are sold on proposal, not finished product, the finished product can vary significantly from what we assumed it would be at the time of signing. So I have to figure out what we can do to make the book fit. Can we add pages to the index, or subtract pages from the index? Can we add or subtract front matter? Can we go up to 2-page chapter openers or down to 1-page part openers? We can’t go over or under more than 16 pages for any project. Usually it’s not a big problem but sometimes you should see my desperation!
Do you use any technology to help with this math?
We use a special calculator based on trim size to estimate how many words per page, taking design considerations into account (lots of sidebars or illustrations mean fewer words on each page). For the budget, I just use a spreadsheet. This just helps make sure simple errors in addition or subtraction don’t through the whole process off.
How do you think math helps you do your job better?
On a fundamental level, if I don’t do the math right, the company and everyone in it suffers. We miss our projections, we overrun our budgets, we even screw up our earnings. That’s a big deal. It also helps me be creative and to make better judgment calls. If I find myself saying, “Well, it doesn’t really matter if this one book doesn’t fit the page count, I can just get the publisher to change the page count,” I know I’m being lazy. Maybe that is what has to happen sometimes, but that type of change directly impacts our profit-and-loss statement for the title, so it has to be the last resort. Same with the budget. “Well, the publisher isn’t going to kill me if I go over by a little bit.” That’s true, but it’s a lazy way of thinking. Doing the math makes me think about what I need to do differently to hit the budget. In some instances, yes, the budget simply needs to be bigger. But it could mean I need to watch what I acquire so I’m not picking up things with potential but that require a ton of editing. It could mean I need to streamline a process somewhere or develop a template instead of doing some type of custom approach each time.
Math adds a lot of clarity to my work—something I never thought a book editor would say!
How comfortable with math do you feel?
I am pretty comfortable with math except when I am put on the spot (like someone asking me point-blank to answer a math question). I find the math at work to be easy in the sense that I’m confident about not making mistakes with it. I do it in the privacy of my office, so if I have to check my calculations five different times to make sure I’ve got them right, I do it.
What kind of math did you take in high school?
I got as far as Algebra II and felt like a complete idiot by that point.
Did you have to learn new skills in order to do the math you use in your job?
I had to get over my fear of “oh my god I will screw up the math and they’ll kick me out and I love this job!” Other than that, though, the math is straightforward—definitely something a high-school kid could do. Probably a third-grader could do it
Thanks for playing with us today, Jennifer! If any of you dear readers are interested in writing and publishing a book, check out Jennifer’s great book proposal class. (I can recommend it from personal experience!) Or feel free to ask her a question in the comments section.
Sometimes information comes in these big, boring stacks — and without the coffee. Media professionals crunch it, so you don’t have to. (Photo courtesy of misspudding)
In 1998, I landed my first real media job — as a content producer at PilotOnline and HamptonRoads.com, websites for The Virginian-Pilot, a daily newspaper in Norfolk, Va. My first assignment was to develop and launch a schools section, featuring interactive content like a lesson plan database, information about local schools and the results of statewide test scores.
Each year, I’d get notice that the Standards of Learning test scores were about to be released. I’d have three days to download the data, organize it into a database and then output it on the site. When the information went live, visitors could look up their school and see results in a variety of subject areas. They could even answer sample questions to see how they would fare.
I had a blast. Seriously.
For the first time in my career, I was combining my degree (math) with my passion (journalism). And it was fun.
Fact is, there’s lots and lots of math in publishing and media. But every single day, some poor English major is shocked to find out that he needs to add, subtract, multiply, divide or — oh my! — even employ an equation or two in order to do his job well.
But math and media go together like the Pope and his funny hat. Math helps readers understand complex information, and it helps writers and producers create content that people want to read or watch or listen to. Math helps publishers save money. Math helps readers scan the newspaper over a bowl of Cheerios — and get the gist of the story.
Here are some examples:
1. Instead of publishing the entire Census results, a newspaper crunches the numbers and creates colorful charts that are easy to read and understand.
2. Meteorologists don’t guess the weather forecast; they review previous data and apply what they know about weather to predict when we’re about to be hit with 17 inches of snow.
3. When you read a book, the text is arranged so that the number of pages is divisible by four — and you’re not skipping over blank pages.
4. A website will average the starred reviews of a movie so that you don’t have to read each and every reviewers opinion.
And then there are the countless examples that most readers, viewers and listeners aren’t even aware of.
Here at Math for Grownups, March is devoted to publishing and media. Throughout the month, you’ll meet folks in these industries and learn how they use math in their jobs: like Jennifer Lawler, who is an imprint manager for my publisher, Adams Media, and Tony Pann, on-air meteorologist at WBAL-TV. And of course we’ll delve into a variety of topics — from making graphs to critically analyzing a reporter’s numbers.
Whether you’re a writer or broadcaster or just a consumer of media, make sure you come back this month. You just might learn something — or discover that you use math all the time.
Is there a topic you’d like me to cover this month? If so, drop me a line, and I’ll see what I can do. Or just post a comment with your suggestions.
In our interview on Monday, professional photographer Sally Wiener Grotta talked about using histograms to help determine the exposure she needs to best reflect her subject in a photograph. If you took any statistics in high school or college — or have helped a middle schooler with her math homework — you may know exactly what a histogram is. But do you understand how these graphs are helpful for photography?
In short, a histogram is a graph that demonstrates variance and frequency. (Stay with me here. I know there are some strange, mathy words in there.) Here’s a really simple example:
The administrators of a health clinic are collecting data about the patients, so that they can provide the most appropriate services. The histogram below shows the ages of the patients.
Even with one quick glance, it’s apparent that the clinic sees far fewer patients who are between 80 and 90 years old. In fact, it looks like the group that’s most represented includes those between 40 and 50 years old.
(If you’re really being a smarty pants, you might notice that the histogram follows the normal or bell curve. But you don’t have to know that to get along in everyday life — unless you work in statistical analysis.)
So here’s what’s special about a histogram:
1. The horizontal line (or axis) represents the categories (or bins). These are almost always numbers, and each one has no gaps. In other words, in a histogram, you won’t have categorical data, like people’s names. Notice also that the data is continuous. Someone who is 43 and 5 months falls in the 40-50 year old category.
2. The vertical line (or axis) represents the frequency or count of each category. These are always numbers. So in the histogram above, 40 people who visited the clinic were between 80 and 90 years old.
3. The bars of the histogram butt up against one another. That demonstrates the fact that there are no gaps in the data and the data is numerical.
4. The taller the bar, the more values there are in that category. The shorter the bar, the fewer values there are in that category.
So let’s look at a photographer’s histogram:
First off, these histograms are automatically generated by imaging software or even some fancy-schmancy cameras. In other words, technology plots these values. It’s the photographer’s job to interpret them.
You probably noticed that there are no numbers on this histogram. Like a statistical histogram, the vertical axis represents frequency. But the horizontal axis doesn’t represent numbers. Instead, it shows shades. Follow the bar at the bottom of the histogram from the left to the right. Notice how it goes from black to grey to white? In fact, the bar gradually changes from black to white.
If you could blow up this histogram to a much larger size, you would see that it’s made up of lots and lots of skinny rectangles. These represent the number of pixels in the photograph that are each shade. So there are very few (if any) pure white pixels. There are some pure black pixels, but not as many as there are grey ones.
By glancing at this image, an experienced photographer can determine whether an image needs more or less exposure. There’s a great deal of artistry in this — a really dark photo can have a dramatic effect, while certain conditions require more exposure than others.
There you have it. Histograms aren’t just for statisticians. And those silly little graphs you drew in your middle school math class actually have artistic value!
Do you have questions about histograms? Ask them in the comments section!
This Forever 21 shirt is no longer available. (Thank goodness!)
Forever 21 and J.C. Penny had problems with moms and teen girls, when they retailed their own versions of math-as-gender-warfare–t-shirts that read: Allergic to Algebra and I’m Too Pretty for Homework, So My Brother Does It for Me. Within days, the shirts disappeared from the shelves and their websites.
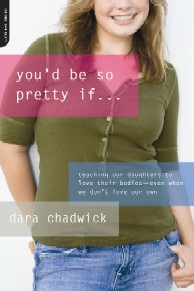
I wrote a guest blog post about this for Dara Chadwick’s wonderful blog You’d Be So Pretty If, which is devoted to encouraging positive body image in girls.
I was a great high school student. I did well in all of my classes (Okay, so I did fail band that one grading period because I didn’t turn in my practice sheets.). I was a responsible and eager student. But there was one subject that was a challenge for me: French.
I tried. I really did. But for whatever reason, the most romantic of all of the romance languages did not come easy. I had good teachers. I studied. I paid attention in class. But the best I could do was a low B — and that was with a lot of hard work.
Still, I didn’t have a t-shirt that read, “French Phobic.” I’ve never heard of a Barbie doll that says, “French is Hard!”
So what’s the deal with math?
Math is hard. But so is writing, reading, playing an instrument, painting, soccer, woodshop and, yes, French. In fact, if teachers and coaches are doing their jobs, students will feel challenged — which can bring up a variety of other feelings, from frustration to enthusiasm.
You’d Be So Pretty If… by Dara Chadwick.
Read the rest here, and be sure to comment. Also, check our Dara’s wonderful book You’d Be So Pretty If…Anyone who knows a teenage girl should!
So what do you think about these t-shirts? Are they all in fun or bad for girls? Why does math get such a bad rap? Share your ideas in the comments section.
It’s the No. 1 question asked of math teachers: “When will I ever use this stuff?”
And in terms of upper-level math — conic sections, radicals, differentiation and the quadratic formula — the answer may very well be, “Not much.” (Unless you’re in one of those jobs with top-paying degrees.)
As I hope you know by now, basic math is ubiquitous. We encounter percents, fractions, formulas, the order of operations (Please Excuse My Dear Aunt Sally) and geometry pretty regularly. But algebra? When was the last time you solved for x?
Algebra describes the relationships between values, and how those values change when we introduce variables. In short, algebra is based on equations or expressions:
3+x
x2+4x-7
y=5x+9
(Are your hands sweating or have your eyes glazed over? Hang in there. I promise this won’t be overwhelming.)
In its simplest form, algebra can be described as the process of solving for a variable. And you probably did that with random equations for a good portion of your high school math education.
Boring.
Except for word problems, none of the equations had much to do with real life, which is one way that we math educators have sucked all of the life out of math.
But I’m guessing that at least some of you use algebra pretty darned regularly–without even knowing it. Let me show you how.
As a freelance writer, I’m responsible for maintaining my business records, which for me include expected and actual income, invoices and goals. I could purchase accounting software for this or hire someone to do the work for me, but to be honest, my business is pretty small. I have a lot of experience with spreadsheets, and so six years ago, I built one that I still use to track all of my business finances and goals.
Why does this work? Formulas. One formula gives me the total of all of my invoices for each month and and another spits out the percent those are of my monthly goal. I have created formulas that give the percent of my income that is generated from each of my revenue streams. And because of formulas, I can instantly see how much income has been invoiced but not received.
But maybe this isn’t such a great example. Most small businesses or self-employed folks use ready-made accounting programs for these tasks.
Meet my good friend, Rebecca. Like many of us in my neighborhood, Rebecca’s family gets milk delivered once a week by a local dairy. (I know! Cool, right?) But unlike me, she shares her delivery with her next-door neighbor. And that requires a little bit of math. Here’s how she explains it:
As you know there are bottle deposits, bottle charges, delivery charges and of course milk (or other product) charges. The charges go to only one credit card. Keeping track of these is a challenge if you don’t want to have to write a check to your neighbor every week – and who wants that? So we have worked out a “kitty” (nice, eh, milk – kitty. ha ha) system where we pay a lump sum to the person whose credit card is being charged. But then we have to know when the kitty is running out.
In other words, each of the families contributes to the kitty, and those funds are used to pay the milk bill on one family’s credit card account. Rebecca uses a spreadsheet to keep up with how much money is in the kitty at any given time. When the kitty runs low, she knows to ask her neighbor for a contribution.
Rebecca’s milk delivery spreadsheet
Why doesn’t Rebecca ask for the same monthly payment in the kitty? Well, this is where the algebra comes in. Not only can we order milk, but also yogurt, meats, eggs and cheese. That means the weekly orders vary. And — here’s where you can use that English degree — when elements vary, they’re called variables.
Ta-da! Algebra in real life. (Gosh, I’m so proud!)
These spreadsheet formulas are so useful that algebra teachers are using them to demonstrate how algebra is indeed useful in everyday situations.
So, when was the last time you used a spreadsheet? Did you create a formula? Did you know you were using algebra? Tell us about it in the comments section.
First, I found out that USA Weekend— the weekly newspaper supplement that appears in more than 800 newspapers in the U.S. and is read by 4.7 million people each week — published a cool, little story about Math for Grownups this weekend. “Man,” I thought. “This is great!”
Then I read the first and only (at the time) comment:
In “Benefits vs. Raise” I am surprised you made the common mistake of thinking you will make less money if you get a raise. If you move to a higher tax bracket it is only the incremental money that is taxed at the higher rate. You should print a correction.
Long story short: my explanation in Math for Grownups is correct. Sadly, for Gregory Connolly, the reporter who wrote this otherwise really nice story, some of the information in the article was not. In a few days the geeky little corner of the blogosphere that pays attention to these things went nuts. I’ve gotten emails, nasty tweets and more — even after I posted what I think is a very level-headed response to the original comment, letting readers know that the error was the reporter’s. And even after USA Weekend posted an excerpt from my book that explains (correctly) how math and the tax system work in this situation.*
Hoo-wee! When math, taxes and mistaken reporting collide, sparks fly!
I’m still trying to figure out if this is a good thing for me or a bad thing. (Is any publicity good publicity?) But this whole experience illustrates a few interesting points:
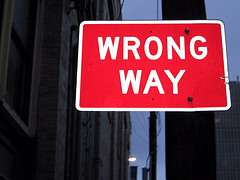
1. Math matters. When you think that you don’t need to understand how math applies to the tax code, think again, my sister and brother. I’ve got dozens of internet commenters and tweeters begging to convince you differently. And quite honestly, they’re not as nice as I am.
2. It’s critical to check your assumptions. I’m convinced that Mr. Connolly wouldn’t have made the same mistake had he really considered what he was writing. Yes, it’s a common mistake and even an element of misinformed political rhetoric to believe that a raise could actually be bad for a person. But really? Does that make sense? Just like with math problems, checking to see if the answer is reasonable can save anyone from a lot of heartache. (And I’m thinking this reporter has had at least some heartache this week.)
3. There’s good reason that people are scared of math — big, mean, know-it-alls shame us into believing that a simple misunderstanding or mistake will bring down entire civilizations, crush the delicate sensibilities of our dear children and bring us perilously close to either left- or right-wing political domination. In other words, if we don’t get every single syllable and number absolutely correct, we are wrong, wrong, wrong and nothing can save us from eternal shame and damnation.
(How many of you felt this way in school?)
But whether or not these internet commenters, bloggers and tweeters would like to admit it, not much about math will cause such drastic, awful consequences. Sure, there may plenty of people more than willing to shout, “YOU’RE WRONG!” rather than admit that they, too, sometimes feel like math is hard and the tax system can be difficult to comprehend. But in the end, I’m here to say that the basic math that most of us have to do everyday both matters and won’t kill you.
The fact that I’m still alive, sober and writing about this after the frenetic tongue lashing I’ve received over the last few days is testament to this. You can survive making math mistakes (or other’s math mistakes). And I honestly hope that someone is telling the poor Gregory Connolly this very thing.
So let’s fess up. What was your last math mistake? Did it cause the ground to open up and swallow up innocent puppies and kittens? Or did you just lose a little cash or miss the previews at a movie or put too much fertilizer on your lawn?
Share your math horror stories in the comments section.
*Update: USA Weekend is continuing to finesse its response to this situation. The last section of the article has now been rewritten to correct the mistake, and the excerpt from my book has been removed.
Earlier this week, I provided a guest post about math anxiety and kids for Imp3rfect Mom. I wasn’t surprised to get a comment from a reader asking about how to deal with her math anxiety.
My son is an adult so my question concerns me. I’m almost 60 and I’ve been mathphobic (big time) since I was in 6th grade. At that point math just crashed and burned for me and I struggled for the rest of school. Now I am self studying for a designation related to my job (the job itself doesn’t require math ability) but I have to learn some equations for the Time Value of Money for the last exam. I look at that chapter and just freeze. I actually am telling myself “well, if I just skip that part and study real hard, I’ll still pass the test.” This is ridiculous! How do I conquer 50 years of Fear of Math?
I’m sure you can hear the frustration in her writing. (Do you ever feel the same way?) I anxious about certain things–making difficult phone calls, traveling to places where English is not the predominant language, or asking someone for help when I’m lost. (That last one is so silly, isn’t it?)
I’ve talked about the roots of math anxiety–the insistance that the goal is the right answer, timed calculations and an expectation of perfection–but now it’s time to share some ways to cope.
Allow yourself to fail. This is not so easy when you’re dealing with your finances or preparing to take a test. But when you’re learning (or relearning) something, you will make mistakes. Heck, even when you have something down cold, you can screw up. If you’re feeling anxious about math, set up low-stakes scenarios when failure isn’t a big deal. Try things on your own, for example, and allow someone you trust to check your work.
Ask yourself, “How hard can it be?” I’ve said this before, if I can do this stuff, so can you. I don’t have the typical “math brain.” I can’t do mental calculations, and sometimes I forget really basic facts like 6 x 7. And believe me, if a fourth grader can do these tasks, so can you.
Make it fun. I swear, I’m not violating math secret #3 (You Can Skip the Love). You don’t have to have fun or love math to be good at it. Still, if you’ve read my book, you know what I mean. Too often, math is cut-and-dry, boring numbers. When it’s presented or explored using real-world stories with funny characters, it’s a lot more tolerable. So, whether you’re studying for a test or trying to explain a concept to your kid, try making up problems using Sesame Street characters or your crazy Aunt Miriam who has 76 cats and wears a fedora. The sillier the better.
Find resources that work for you. I’m a big DIYer. And everything I know about sewing, painting, renovations and carpentry, I learned from Google. I promise. Besides my book, there are amazing resources out there for folks who need a little refresher. You can even find videos on YouTube or Flickr tutorials. But be careful: sometimes mathematicians think they’re being really helpful, when they’re not. Don’t let yourself be overwhelmed by minute details or unrelated tangents. Click through these resources quickly until you find what you need.
Trust your gut. Just because a textbook or a friend has the information you need, doesn’t mean you need to follow that advice or process. This is the beauty of being a grownup–we don’t have to follow the rules that a teacher sets out for us. Think about when you feel comfortable with math. Is it in the kitchen? When you’re gardening? When you’re doing your budget? What is it about that process that is less threatening? Use what you know about yourself–and your learning style–to step into these other, scary places.
So I’d love to hear from you now. What tricks have you used to conquer your anxiety or fear–about anything? If you have dealt with math anxiety in the past, what has helped? Share your ideas in the comments section.
Things that make many kids anxious: a new school, big dogs, the deep end of the swimming pool, bees, strangers, nightmares, math.
Did you notice something there? For many children, math and bees are equally frightening or at least nerve-wracking.
Not all kids have math anxiety, but it’s not uncommon for elementary, middle or high school students to express nervousness about learning math or taking math tests. At the same time, these students may also feel less confident in their math skills or even say that they hate math.
Want to know how to eleviate math anxiety–for your kids and yourself? Check out my guest post at Imp3rfect Mom. You could win a free copy of Math for Grownups!Would you like me to guest post at your blog? Or do you know of a blog that I would fit right in with? I’ve got lots of ideas to share with anyone who will listen! And I promise I’m a good guest. I wipe out the sink after I brush my teeth and don’t mind if the cat sleeps on my pillow. Get the details here.
According to the headlines, we were born either good or bad at math. At least that’s how this study is being interpreted by bloggers and news outlets. Except that’s not necessarily what the study concludes.
This makes me mad. Really mad. I have not read the full study, but nothing in the abstract–or even the stories and blog posts about this study–suggests that people are born with or without math ability. Instead, it seems that the cheeky headlines were just too good to pass up.
Here’s what the study author, post-doctoral student Melissa Libertus, does say:
The relationship between ‘number sense’ and math ability is important and intriguing because we believe that ‘number sense’ is universal, whereas math ability has been thought to be highly dependent on culture and language and takes many years to learn… Many questions remain and there is much we still have to learn about this.
And here’s the nitty gritty on the study itself. A group of 200 children, with an average age of 4 years old, was given a number sense test. (You can take the exact same test here). These children were then asked to perform a variety of age-appropriate math tasks, including counting, reading numbers and computations. The results make a lot of sense: children who performed well on the number sense test did better on the math tests.[pullquote]No one says that we’re born good or bad at reading. We’re all expected to learn to read–and read well. So why do we say that about math?[/pullquote]
But the results seem to be misrepresented by media and others. These kids were selected precisely because they haven’t had any formal math education. They’re preschoolers. So, according to many news reports, kids are either born with number sense or get it from formal education.
Rubbish.
If you had a child in the last 10 or 15 years–or know someone who has–you are probably familiar with the big, big push for early literacy. Parents are encouraged to read to their kids, even when they’re babies, which research has shown helps the children develop age-appropriate literacy skills. In fact, kids who have had access to pre-reading experiences as infants, toddlers and preschoolers do much better with reading in elementary school. (This is one of the tenets of Head Start programs around the country.)
No one says that we’re born good or bad at reading. We’re all expected to learn to read–and read well. So why do we say that about math?
Just like the researcher, I think this study raises more questions. And here’s the really big one: What can parents do to boost their kids’ numeracy before formal education begins? (I actually wrote about this earlier this week.)
I still maintain that we are born with an innate understanding of math–just like we’re born knowing something about language. But without stimulating this understanding, kids can fall behind their peers or at least not reach their full potential. We read to little children so that they can learn to read on their own. And we should be doing something similar with kids so that they can do math.
A friend and fellow math blogger, Bon Crowder has launched an amazing program she’s calling Count 10, Read 10. It’s a simple idea: Parents should spend 10 minutes each day reading to their young kids and 10 minutes doing some sort of math with them. But nobody is saying flash cards, worksheets or chalkboards are necessary. The trick is to sneak the math into everyday activities, which can be as simple as counting the steps your new walker takes.
So here’s what I think happened with the news reports of this study: reporters, editors and bloggers simply tapped into their own misconceptions about math–and even their own math anxiety–and distorted the message. For many people, it’s a “fact” that some people are just naturally bad at math. I hope you’ll help me challenge that notion.
Meanwhile, be careful what you read.
P.S. A great math educator, David Wees has also chimed in on this topic, and shares–more eloquently–some of the same concerns I have. Read it!
So what do you think? Are people born good or bad at math? Can parents help develop numeracy in their children? How? Share your ideas in the comments section.