The bad: You do need math, even as a writer. Whether you’re reporting on a business, interpreting statistics or managing your freelance career, math is a big deal.
The good: You don’t have to like it. The better: Forget about finding cosine or using the quadratic formula. A few basics are all you need. You can start with these:
1. Calculate a percent. You learn that a company’s revenue has fallen by $2.5 million over five years. That’s a lot of money, right? Well, actually it depends on the company’s revenue over the last five years. If total revenue was $5 billion, the company lost 5 percent. To calculate that, divide 2.5 million by 5 billion. But if the company’s total revenue over five years was $5 million, the company lost a whopping 50 percent. Using a percent gets to the meat of those numbers.
Want to know what really burns me up? Telling a kid he’s not good at math. Know what’s just as bad? Telling a mom that her kid isn’t good at math.
This morning, I was early for my fitness boot camp class. (Sadly, I don’t get to work with Robert the personal trainer.) I chatted with a couple of the women who, like me, show up every morning at 6:45 for an hour of torture. Of course, I had to share that I got advance copies of my book, Math for Grownups, yesterday. Per usual, the conversation turned to the absolutely ridiculous and completely frustrating notion that people are either good at math and science or they’re good at language arts.
Now, for the record, I wholeheartedly disagree with that line of thinking. (Can you tell?) Keep reading to find out why.
One mom said that her son’s first grade class was good at reading but not math. How did she know this? The teacher told her. There are so many unbelievably wrong things about this situation, and thinking about it makes me want to scream:
They’re first graders! How can six year olds be bad at math? They might be missing some basic concepts, like counting up to add or the difference between a triangle and a square. But remember, nobody is born bad at math.
It’s the teacher’s job to make sure kids understand basic math concepts. Blaming the students is a cop out.
Telling parents that an entire group of kids is bad at math is a self-fulfilling prophecy. Already, parents (and other grownups) believe that math ability is like being tall or having blue eyes–you either have it or you don’t. This teacher may have unwittingly reinforced this idea, by making such a silly generalization.
If she told the parents this, what message is she sending the kids? If you’ve been a parent, you know that there are a trillion different messages that we send to our kids every day, without even knowing it. I would bet my last dollar that this teacher is somehow relaying to her students that math is just not their thing.
First graders who think they’re not good at math, grow up to be middle schoolers who think algebra is beyond them. These middle schoolers of course awkwardly morph into teenagers who are convinced that they won’t need (and can’t do) geometry, trig, advanced algebra, probability, statistics and calculus. And then of course, these acne-prone, love-sick adolescents become the smart, successful adults who tell me every day that they desperately need my book, because they can’t balance their checkbooks to save their souls.
But really, I’m not blaming this one teacher. I promise. She’s just the beginning of a long line of teachers and other grownups who buy the lies about math: that only people with “math brains” can comprehend the Pythagorean Theorem and no one uses math in everyday life anyway.
So, what’s the solution? The issue is not the students. The issue is that we somehow believe that there is only one way to teach math. Of course that’s not true. Teachers and parents have to figure out how our kids think and approach math in a way that makes sense to them. And we have to quit labeling ourselves and our kids.
All you parents out there, I’d be forever grateful if you’d do just one of these things:
If a teacher says your kid is bad at math–or worse, declares an entire class bad at math–please challenge him or her. There are only a few people in the world who have real issues with processing mathematical information, and I’m betting your kid isn’t one of them.
Stop telling people that you, yourself, are bad at math. Next time your dinner companion asks, “Can you help me figure out the tip?” bite your tongue. If you truly can’t find 15% of $24.68, pretend you didn’t hear or fake it. But please avoid saying the all-too-common, “I’m so bad at math!”
If you can’t help your kid with his homework, don’t declare: “I just don’t have the math gene!” Here’s the reality: You may not remember how solve a proportion, but that’s because you probably haven’t seen one for at least 15 years. If you were asked to diagram a sentence and couldn’t do it, would you say that you’re no good at speaking English? Of course not.
Replace your generalizations about math ability with messages like these: “I don’t remember how to do that. Let’s figure it out.” or “I remember doing these kinds of problems in school, and they gave me trouble. But I’m sure we can figure it out together.”
And just a quick footnote/disclaimer: I am the biggest advocate of schools and teachers that you will ever meet. Having been a public school teacher and been raised in a family of teachers, I’ve seen first-hand what our educators face on a daily basis. I just wish I didn’t hear stories like the one I heard this morning.
I’m going to gingerly climb off of my soapbox now. (My glutes are killing me after that workout!) But I ask you to share your thoughts on these generalizations about math ability and math education. What messages have you or your kids received? What do you think about them? How do you think we can counter them? And for all you teachers out there: how do you send the message to your students that they are good at math?
I’ve decided to start a regular feature about math education, called Summer School. In it, I’ll discuss some ways that parents can send the right messages about math. We don’t need another generation of grownups who think they can’t do math! 🙂
What is a television line producer, and how long have you been doing this job?
Production companies hire me after they’ve received the “green light” to develop and produce a new television series. The first thing I do is read something called the bible, a document that explains the concept, visual look and tone of the show. My job is to create a production budget based on the amount of money the executive producer has for the entire project. For example, if he or she gives me $6 million to produce 26 episodes, I need to allocate every cent within several dozen categories over the length of the production. I also create the pre-production, shooting and post-production schedules, assist with casting, hire the technical crews and then oversee the whole project from beginning to end. I’ve been doing this work for 23 years.
When do you use basic math in your job?
I have to break everything down in the budget and make sure we only spend what we have! So for example, I have to figure out how many days we need a wardrobe assistant, how much it will cost, and make sure we have some wiggle room for overtime, extra prep days, etc. Sometimes, if I’m working on a smaller budget show, I’m the one who calculates the actors’ and technicians’ time sheets, so lots of adding, multiplication, etc.
Every week or so, I have to do cash flow reports; how much I estimated to spend, the actual costs, and estimated future costs. It all has to balance out, so if we do lots of overtime one week, I need to figure out what needs to be cut over the coming weeks to make up for that shortfall.
Do you use any technology (like calculators or computers) to help with this math? Why or why not?
Oh yes!! Time sheets are now calculated on the computer, but I still check everything with a calculator, as I’ve fallen victim to incorrect formats. Nothing worse than a camera operator coming up to you saying his paycheck is wrong!! Cash flows and budgets are either done on Excel or through special software, often MovieMagic, which has programs for film and television scheduling and budgeting.
I have to admit I also still count on my fingers sometimes
How do you think math helps you do your job better?
It forces me to focus on what is perhaps the most important part of any creative project: the bottom line. Television is lots of fun, but it’s a business, and the executives and broadcasters expect me to deliver a project on budget. Time is money when you’re on-set, so even 15 minutes of overtime can sink you, if you have dozens of cast and crew to pay. Math makes me more organized!
How comfortable with math do you feel?
Today, I’m very comfortable with math, but since I have a tendency to do everything quickly, my challenge is always to slow down and get it right.*
What kind of math did you take in high school?
I hated math all through school, and always excelled at writing, and other creative subjects. I had one fabulous math teacher in tenth grade who finally made math fun. Good thing I was in his class, because I’d always figured I’d never need math to pursue my career goals, but was amazed years later to discover how much math I needed when I started working in television production. I was a script supervisor whose duties included timing segments with a stop-watch, adding things up and making sure we wouldn’t go into editing with too many long scenes. I was terrified of making math errors, and realized quickly to slow down, relax and always double-check my work.
*This is perhaps the best advice I can offer anyone who is struggling with math. Only your fifth-grade teacher and the Mathletes coach care how quickly you can do calculations.
If you’re used to a completely different Math for Grownups website, hold up. You’re not in the wrong place. For the last two months (or more?), I’ve been working on a redesign of the site. I wanted something fun, punchy and energizing — kind of how I feel about math. And with my newest book, Math for Writers, hitting Amazon last month, this was a great opportunity.
And it’s not just a new book to celebrate! You’ll notice some really cool additions, plus a few old friends. Here’s a quick run down.
Sections for Writers, Parents, Teachers, and All Grownups
If you fall in one of these categories — and unless you’re a kid, you do! — you can zip right over to see the content I’ve developed just for you. Writers will find great ways to develop their craft and manage their writing. Parents will find tips for growing math-confident kids — without losing their minds. Teachers will find resources they can share with parents and students, including the answer to the age-old question: “When will I ever use this stuff?” At the same time, everyone can learn how math can help us make smarter financial decisions, save time and think about math in a completely different way.
OMG, Quizzes!
I can’t tell you how excited I am to introduce original, interactive quizzes. But before you freak out: There is no timer. There are no grades. No one has to know how you did. And that’s exactly how I wanted it. My goals are pretty simple: Show you what kids are learning at various grade levels, and give you a chance to see what you remember (or don’t). I’ll be adding quizzes over time — hopefully one a week or so. And I’ll add some non-math quizzes too, like “Are You REALLY Math Anxious?”
Coming Soon: Online Learning
If reading a blog or a book is not enough for you, I’m gearing up to offer some very targeted online learning. First up will be courses designed just for writers. Over time, I’ll add courses for parents and others. Through Facebook groups, webinars and “homework,” you’ll have a chance to take a deeper dive into the math that you need — but can’t quite grasp. These aren’t college courses, and you won’t be graded on your assignments. The idea is to give you a little special attention, so you can ask specific questions, gain some confidence and learn a few things. Stay tuned!
Math at Work Monday Is Back!
I know that this is a very popular feature on Math for Grownups, and I’ve got a whole series of greatMath at Work Monday interviews lined up. You’ll meet recycling truck drivers and cancer radiology specialists. And if you have a suggestion of someone I should interview, send me a note. I’m always looking for fresh ideas!
Take a look around. Read my new Math for Grownups Manifesto. And let me know what you think. I’m really looking forward to injecting even more energy into math.
Oh, and if you haven’t received my free gift for you, don’t miss out. Just sign up in the bright yellow box to the right, and you’ll get a free copy of Multiply Your Math Moxie: A Painless Guide to Overcoming Math Anxiety. Get comfortable with math, once and for all.
Got your sharpened No. 2 pencils? Graph paper? Protractors? It is definitely back-to-school time. Whether your little genius attends public or private school or learns at home with you, as a parent you can look forward to afternoons at the kitchen table talking about multiplication tables, coordinate geometry and trigonometry.
Maybe this thought scares you a little. Maybe you are worried that you won’t be able to help your kid when she’s confused. Maybe you hate the way she’s taught math. Those are all great reasons to focus on math education this month. Throughout September, I’ll bring you posts that help boost your confidence and even understand the math your kid is doing. I’ll have guest posts about math anxiety— a huge problem for lots of kids (and adults) — and I’ll continue bringing you Math at Work Mondayinterviews, from people with cool jobs that your kids want to have.
Have questions that you want to see addressed this month? Ask them in the comments section or send us an email. I’ll track down the answers, so that you can feel good about the math your kid is learning and your role in that process.
To start off, let’s revisit some of the most popular Math for Grownups posts of all time. In this short series, I asked teachers, parents and kids what they wanted from each other when it comes to math education. And boy howdy, did they tell me! See if you recognize yourself in any of these lists.
I am not a particularly athletic or physically active person. If given a choice between a hike through the woods or a book and a hammock, the good read always wins out. I start and stop exercise routines at least once a year — usually more. But I do have a bicycle, and once a year, I sit atop that tiny seat and pedal my way through 14 miles of parks in Baltimore.
That was yesterday, and today I’m paying for it, big time. Not only do I have a funny-shaped sunburn on my back (from the one cool exercise shirt that I have), but my legs and feet and rear end are screaming: “What the hell??” Still, I know I’ll do this next year, too. Because it’s the one time a year that it’s worth hoisting three bikes on top of our car and driving 15 minutes away to explore the city parks.
Of course, I think about the math involved. Between birdwatching and listening to my almost 12-year-old complaining, what else is there to do? Here’s what I came up with.
1. I woke up yesterday morning with one thing on my mind: I do not want to spend all day on a bike. But would it be all day? Not likely. So I went to the interwebs to help me estimate the time I’d actually be cycling. Here’s what I found:
For the kind of biking I was about to do, an average speed is about 10 miles per hour. I didn’t even bother with a formula; this information was enough to help me estimate that I’d be pedaling for about 90 minutes or so. (I figured I’m slower than average, we’d have one 5-minute break, and we were biking 14 miles, not 10.)
How did I do with my estimate? Not bad. We pushed off at 9:00 a.m. and were munching hamburgers and hotdogs by 11:45 or so.
2. I once thought that the pedals and brakes and chain were the most important parts of the bike. But it turns out that the seat height has more to do with a comfortable ride than most anything else.
Last year, I spent the first half of the course on a seat that was way, way too low. My thighs were burning by the time we hit the rest spot. Luckily, there was a bike tech there who showed me how to adjust my seat and where. I thought I would fall off the precipitous height when he was done, but the rest of the ride was a breeze, comparatively speaking.
Here’s how it works: The leverage of your pedaling is controlled by the seat height. If your seat is too low, you’ll work way, way too hard to get up even the most modest hill. In other words, when your seat is adjusted properly, you’ll get the most efficient pedal stroke. (And your rectus femoris muscle will thank you.)
There are formulas and online calculators that can help you figure this out. But as a once-a-year biker, I rely on a simple idea. When sitting on my bike, I position my feet at 12:00 and 6:00. If my leg is completely extended in the 6:00 position, my seat is at the correct height.
There’s tons more math in cycling, I’m sure. But as a novice, these little calculations and estimates are enough for me. By next year, I’ll forget how sore I am today — and the trouble it is to get our bikes into the rack — and hit these trails again.
Are you a cycler? What math have you used to help keep your pedaling efficient or manage your rides? Share your ideas in the comments section.
Wait! Isn’t it Monday? Where is Math at Work Monday? It’ll be back, I promise. I had some scheduling problems with some sources, so you may see an interview later this week. Don’t worry!
I grew up in the 70s and 80s with teacher parents and in a small town that I could roam pretty much at will. Summer was both amazing and boring. School was out, and I could stay up late (at least until the sun set). These were the months when we traveled — sometimes on a big trip, but always for a week to Virginia Beach, where we would rent a big house with all of my cousins, and I would get brown as a berry. I remember riding my purple bike with the banana seat and long handlebar streamers. Or spending my days at the pool and nights at the local movie theatre. Instead of canned green beans or tomatoes, we’d have at least three sides of fresh vegetables every night at dinner, and I could pick the raspberries in my yard as I mowed the lawn.
Life was slow and easy in the summer. And that’s exactly what I strive for now. I’m not as tolerant of the heat as I once was, but I’d much rather be barefoot and sleeping with the overhead fan on high. I try to knock off of work a little early each day, and I visit the farmer’s market every single Saturday morning.
So even though it’s not officially summer yet, June is dedicated to the math of summer. I promise not to sap all of the fun out of the most relaxing month of the year, but I will point out the math that is around you — from the vegetable garden to the pool, and from bike riding to watching the temperatures rise. In Math at Work Mondays, you’ll meet summer camp coordinators, a summer sweets maker, a pool manager and more.
A note about kids and math over the summer: I know that some parents worry about their kids losing math skills while on vacation. While this month’s content can certainly be used to keep kids engaged with the math side of their brains, I’ll devote all of August to this important task. And you can always visit me at Mom’s Homeroom, sponsored by Kellog’s Frosted Mini-Wheats on MSN.com, for great advice. (More articles and Q&As are coming soon!)
I hope you’ll join me in exploring the math of summer. If you have questions you’d like to see answered or themes that you’d like me to explore, please drop me a line or comment below. I’m always looking for great ideas to explore.
Meanwhile, enjoy the warmer months. Let’s dive into summer!
January 2012 seems extra long! In fact, there are five — count ’em, five — Mondays in this month. And while I’ve never missed a Math at Work Monday, I decided to take a break this week. (Want to read up on previous Q&As for this month? Check them out: Robert the exercise physiologist, Janine the professional organizer, Jameel the budget counselor and Kiki the career coach.)
This month has been all about New Year’s Resolutions: getting in shape and getting organized, boning up on budget basics and becoming your own boss. But what are our chances of actually succeeding in any (or all) of these things? Once again, I ask you: let’s look at the math.
According to a 2008 survey conducted by author and motivational speaker, Steven Shapiro and the Opinion Research Group (Princeton, NJ), 45 percent of Americans set New Year’s Resolutions, but only 8 percent of these reach their goals each year and 24 percent say they never keep their resolutions.
(Disclaimer: I really can’t vouch for the veracity of this study, because I can’t find the data. But let’s go with it, just to prove my point. The numbers aren’t really all that important.)
How many of you read those statistics and thought: “Well, there’s no point in even making resolutions! With chances like those, I’m doomed to fail!”
Here’s the good news: If you nodded your head, you are not alone. And here’s the better news: Statistics don’t work that way.
It’s easy to look at stats and think that they must be true and must apply to everyone in every situation. Cold, hard numbers don’t lie, right? Maybe the numbers don’t lie, but it sure is tempting to use those numbers to describe something that isn’t true. (Politicians do it all the time.)
There are a couple of ways to describe this particular fallacy. But I think one of most important is to consider what is known as independent events. See, each person who sets a New Year’s Resolution is independent of all of the other people who do the same thing. (Even if you’re all making the same resolutions.)
And it gets even trickier. Each year that you set a resolution is independent, and each resolution that you set is also — you guessed it — independent.
In other words, your success probably doesn’t have much of anything to do with how well others have followed through on their yearly goals — or even how well you’ve done in years past. (I say probably, because you may be one of those folks who is easily influenced by statistics. In other words, you may decide that you cannot succeed in meeting your resolutions, simply because you read somewhere that most people don’t.)
There’s tons of research out there on why people make resolutions and how they can be successful in them. If you looked at this research and determined that you have many of the same obstacles, maybe — just maybe — you could predict your chance of success.
But simply because many other people aren’t successful doesn’t mean you are automatically doomed to fail. Independence is only one reason for this. Randomness is another.
Dice are random, but people aren’t. (In fact, I saw a great video that demonstrates this last week. Of course I can’t put my hands on it now, but I’ll post a link, if I do.) While a (fair) die only has to worry about gravity, we have many more things that influence our behavior, decisions and more. That doesn’t mean that people aren’t more likely to act a certain way under certain conditions. But it certainly does mean that your New Year’s resolutions are not beholden to statistics.
So, the next time you read an article about the low rate of success with New Year’s Resolutions, remember this: You certainly can succeed — even if you failed last year. And if you are philosophically opposed to New Year’s resolutions, you’ll need a better reason than most people don’t keep them.
How are you doing with your New Year’s Resolutions? Share in the comments section. And come back on Wednesday — I’ll reveal how things are going with me!Save
There. I said it. And I think some of you feel the same way. I don’t blame you.
While I think we’ve gotten off to a good start here at Math for Grownups, I also think it’s time to shake things up. There are so many more opportunities to show you how you use math in everyday life — and perhaps teach you some new tricks.
So starting on November 2, there are going to be some changes around here. Good changes.
I’m keeping what’s working (Math at Work Monday) and chucking what isn’t (Film Friday). I’m also shifting my posting schedule a little. Instead of posting on Mondays, Thursdays and Fridays, I’ll post on Mondays, Wednesdays and Fridays.
Plus, I’m introducing monthly themes. Not only will this help me come up with great, timely ideas, but it’ll also tap into things that you are probably already wondering about. Here’s a taste:
November is for Nesting: As the seasons change (for some of us), we turn our thoughts to cozying up our home and spending time with family.
December is for Holidays: Whether you celebrate religious or secular holidays, there’s a festive buzz in the air.
January is for Resolutions: Even if you don’t make New Year’s resolutions, starting something fresh is probably on your mind.
You can still visit on Mondays to see how ordinary folks use ordinary math in their ordinary jobs. But now my interviews will follow that month’s theme. So in November, you can expect to meet folks who help you transition into winter or focus more on home: a radiator technician, a landscaper, a fabric designer and a chef.
On Wednesdays, I’ll post about the math used in these fields. For example, I may teach you how to figure out if your heating bill is accurate or show you the math of winterizing your windows. Or I may investigate how ratios are used by chefs.
And on Fridays, I’ll be scouring the internet and my brain for projects. I might show you how to build radiator covers or sew new curtains or how to be sure the turkey comes out of the oven perfectly cooked. Of course these projects will involve a little math.
Oh, and in November or December, I’ll roll out a new design for the blog. Yay!
This is your chance to make requests. (Okay, it’s not your only chance. You can always tell me what you think.) If you’ve been waiting to see a job profiled or learn about something that’s always bugged you, post in the comments section. These can be monthly theme ideas, projects or general math concepts that you’d like me to illuminate for you. I promise I’ll take everyone’s thoughts into consideration.
And I’m always looking for folks to interview for Math at Work Mondays. Right now, I’m on the prowl for a chef, a landscaper and a candle maker. (Not a butcher, a baker, a candlestick maker — but pretty darned close!) Feel free to email me with your ideas or post in the comments section.
We writers have all heard about platform, and so many of us have blogs — both to share what we’re thinking and to reach audiences that might also be interested in reading our books. But how can you tell if your website or blog is really working for you? Stats, of course. Since this can be overwhelming, I’ve asked Donna K. Fitch — an expert on WordPress and a fellow writer — to share her favorite tools for gathering and analyzing website stats. She’s broken it all down, making the process easier to understand and to follow. Plus, she’s offering you a free glossary of analytics terms. (I’m snatching that bad boy right up!)
Who’s visiting your website? Is anyone reading your blog posts? Site statistics provide the keys to these questions. Many options exist for providing these statistics, depending on what site platform you use or how much depth of analysis you desire.
Your hosting provider will often show you the rough numbers in your dashboard or cPanel, such as “x number of visitors this month,” but that’s not helpful. That number is the equivalent of the counters people were enamored of a few years back. Seeing “302,455 site visitors since 1997” is not that impressive if you think about it. Site visitors is a raw number that may include the site owner herself, and tells nothing about how many of those visited multiple times.
I design and maintain WordPress sites, so I’ll be focusing on that platform, but you may find many of the same tools available on your site. If you’re not familiar with the terms used, I’ve provided a glossary of analytics terms as an exclusive free PDF download for you.
A suite of free features available on WordPress.com hosted sites, Jetpack offers website statistics. If you use self-hosted WordPress, you can link your account to a WordPress.com account and take advantage of Jetpack as well. At a glance, Jetpack shows you a graph of site visits, referrers, search engine terms, subscriptions, top posts and pages, and clicks. As you dig into the information, you will find an “About the math” section, where their logic is explained.
When should you use Jetpack? When you’re mainly interested in how many site visits occurred when. This number is useful if you want to determine the optimum day to post on your blog. If more people read it on Friday than on Monday, you can adjust the day you post accordingly.
Available for free to anyone with a Google email address, Google Analytics can be quite daunting, but the wealth of information provided is astounding. Hooking your site up to the analytics tracking requires signing up at http://google.com/analytics. You must use a Gmail account for the requested email address. Google provides you with an ID code which you then insert into either all the pages you wish to track, or your site template. After that, wait about 24 hours to see the results.
When you log into the Google dashboard, you immediately see a graph of visits, with information on sessions, users, pageviews, pages per session, average session duration, bounce rate, and percentage of new sessions, plus a pie chart showing the percentage of new and returning visitors. Below that you see three sections: Demographics, including the language of the top ten visitors, their country or territory, and city from which they visited; System, showing what browser they used, what operating system (Windows, Macintosh, Android, iOS, Linux), and what service provider (Charter Communications, Time Warner, etc.); and Mobile, listing operating system, service provider and screen resolution.
While you could spend hours on each section alone, skip down to the Behavior section to see interesting facts about how people interacted with your site. (The Acquisition section is primarily useful to those purchase ads on Google AdWords.) You can learn what pages were visited the most, how fast pages were accessed, and the flow of the user’s behavior through the site. You can even click on Real Time and see who is visiting your site at that very moment.
When should you use Google Analytics? When you’re interested in knowing in detail who’s visiting your site, from where, how often. When you want to tweak your site’s content or architecture in answer to visitor patterns, to enhance the user experience. When you just love seeing all the numbers generated by your website.
This is a highly-rated free web analytics plugin for WordPress. I have only recently installed it, but am amazed at the range of information it provides, some of which isn’t provided by Google. A real-time log shows you who’s viewing your site at any given moment. The Audience section uses the term “daily human visits,” separating out people from visits by bot. Site analysis gives you at a glance how many content items your site has, as well as the number of comments. The Map overlay provides a fun way to see if you’re getting visits from around the world.
When to use WP SlimStat? When you’re a WordPress self-hosted user who wants a rich, broad array of statistics in an easy to use format.
I’d love to hear from you about your experiences with these tools. Please use the comments below to share!
Donna K. Fitch, MLS (Master of Library Science), MCert (Master’s Certificate in Web Design and Development), is the founder and CEO of Maximum Author Impact, creating beautiful WordPress websites, training webinars and other resources for indie authors. She is the independent author of Second Death,The Source of Lightning, and The Color of Darkness and Other Stories, newsletter web editor and member of the Horror Writers Association, and a member of the Alexandria Publishing Group, aimed at raising the level of professionalism among indie authors. In her day job, she is the digital communication specialist in the office of marketing and communication at Samford University in Birmingham, Alabama, USA.
On Wednesday, we talked about sample bias, or ways to really screw up the results of a survey or study. So how can researchers avoid this problem? By being random.
There are several kinds of samples from simple random samples to convenience samples, and the type that is chosen determines the reliability of the data. The more random the selection of samples, the more reliable the results. Here’s a run down of several different types:
Simple Random Sample: The most reliable option, the simple random sample works well because each member of the population has the same chance of being selected. There are several different ways to select the sample — from a lottery to a number table to computer-generated values. The values can be replaced for a second possible selection or each selection can be held out, so that there are no duplicate selections.
Stratified Sample: In some cases it makes sense to divide the population into subgroups and then conduct a random sample of each subgroup. This method helps researchers highlight a particular subgroup in a sample, which can be useful when observing the relationship between two or more subgroups. The number of members selected from each subgroup must match that subgroup’s representation in the larger population.
What the heck does that mean? Let’s say a researcher is studying glaucoma progression and eye color. If 25% of the population has blue eyes, 25% of the sample must also. If 40% of the population has brown eyes, so must 40% of the sample. Otherwise, the conclusions may be unreliable, because the samples do not reflect the entire population.
Then there are the samples that don’t provide such reliable results:
Quota Sample: In this scenario, the researcher deliberately sets a quota for a certain strata. When done honestly, this allows for representation of minority groups of the population. But it does mean that the sample is no longer random. For example, if you wanted to know how elementary-school teachers feel about a new dress code developed by the school district, a random sample may not include any male teachers, because there are so few of them. However, requiring that a certain number of male teachers be included in the sample insures that male teachers are represented — even though the sample is no longer random.
Purposeful Sample: When it’s difficult to identify members of a population, researchers may include any member who is available. And when those already selected for the sample recommend other members, this is called a Snowball Sample. While this type is not random, it is a way to look at more invisible issues, including sexual assault and illness.
Convenience Sample: When you’re looking for quick and dirty, a convenience sample is it. Remember when survey companies stalked folks at the mall? That’s a convenience or accidental sample. These depend on someone being at the right (wrong?) place at the right (wrong?) time. When people volunteer for a sample, that’s also a convenience sample.
So whenever you’re looking at data, consider how the sample was formed. If the results look funny, it could be because the sample was off.
On Monday, I’ll tackle sample size (something that I had hoped to include today, but didn’t get to). Meantime, if you have questions about how sampling is done, ask away!
We’re wrapping up a review of fractions today. If you missed Monday’s or Wednesday’s posts, be sure to look back to refresh your memory on multiplying and dividing fractions.
If you’re the product of a traditional elementary and middle school education, you likely spent many, many months (collectively) learning about adding and subtracting fractions. It is definitely one of the trickiest arithmetic skills to have, but it can also be quite useful. Now that you know how to multiply with fractions, you’re ready to unlock the secret of adding and subtracting them. And it all comes down to multiplying by the lowly, little 1.
This process is really easy — if the fractions in question have one important characteristic. Take a look:
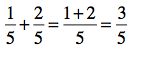
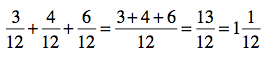
Don’t solve the problem! Just look. What do the fractions have in common? You’re one smart cookie, so I’m sure you recognized that the denominators (the numbers on the bottom of the fractions) are the same — 5. And that’s the key in this process. Whenever you’re adding or subtracting fractions, you need to have common denominators. Then, all you need to do is add the numerators together and keep the same denominator.
If you took a few moments to run this through your brain, you probably wouldn’t have even needed to know this rule. And since we’re grownups, we can use this example: If you have 1 fifth of Jack Daniels and 2 fifths of Johnny Walker, how many fifths of alcohol do you actually have? Well, that would be 3 bottles or 3 fifths. (And believe me, while some of my high school students would have appreciated that example, I don’t think I could have gotten away with using it.)
Same thing is true for subtraction. Let’s say that the fraternity πππ (yeah, I made that up) is having a huge party. They’ve purchased 7 fifths of bourbon. But just before the gig gets started, one of the brothers knocks over the bar and breaks 3 of the fifths of bourbon bottles. How many are left? Well, that would be 4, right? Using this analogy, you can see that because the denominator was the same (5), all you needed to do was subtract the numerators (7 – 3) to get what was left (4).
And here’s where you can break even more rules. As a grownup, you can do these things in your head. If you need to add 1/8 yards of fabric to 1/8 yard of fabric, it’s pretty simple to see that you’re dealing with 2/8 yard (simplified, that’s 1/4 yard).
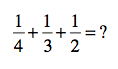
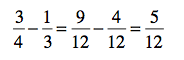
Yeah, things get a little trickier when you have different denominators. Let’s go back to that pizza example from Monday, shall we? Remember, we were figuring out how many pizzas to order, if we knew how much each person typically eats. Let’s say that you can eat 1/4 of a pizza, your sister can eat 1/3 and your brother can eat 1/2? In other words:
Notice something? Yep — no common denominator. So how do you get one? Well, there’s the short cut and then there’s the longer explanation. In case you’re curious, let’s talk explanation first.
You need a number that all three of these denominators will divide into evenly. That’s called a common multiple. In fact, it’s best if you have the least common multiple. (If you have a really good memory, you might remember that this is often referred to as an LCM.) So what’s the LCM of 4, 3 and 2? Turns out to be 12.
So the common denominator is 12, but do you just replace all of the denominators with a 12, adding 1/12, 1/12 and 1/12? No way, Jose. That won’t get you the right answer. What you need to do is change the numerator so that the denominator is 12. And to do that, you need to multiply by 1.
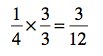
Remember 1 is the same as any fraction that has the same number in the numerator and denominator. So to change 1/4 to a fraction with 12 in the denominator, you’ll need to multiply by 3/3.
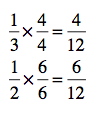
So, think ahead: what do you need to do to turn the other fractions into ones with 12 in the denominators? Multiply by 1. But which 1? You need to think about what number multiplied by the denominator will give you 12.
There’s another way to think about this, for sure. Think about the denominator you want: 12. What is one-fourth of 12? 3, right, so 1/4 is the same thing as 3/12. For some folks, that way of thinking is going to work much, much easier. But you can choose what works for you. Now we can solve the problem:
So in this case, you need a little more than one pizza. You can either ask your siblings to eat a little less (and get by on one pizza) or you can order two pizzas and put the rest in the freezer. (Personally, I’d choose the second option.)
Subtraction works the exact same way! Just find the common denominator and change the fractions. Then subtract, and finally, simplify your answer (if necessary).
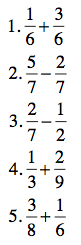
Got it? If not, ask your questions in the comments section. And make sure you try out these practice problems to see how well you can really do! (Remember, no one’s grading anything, so what have you got to lose?)
If you have questions, don’t forget to ask them in the comments section. I also love to hear about different ways to approach these ideas. Don’t be afraid to tell us how you do things differently.
Here are the answers to Wednesday’s practice problems: 15/4, 7/16, 28/15, 30, 1/3.


")


