Categories
Current Events Math for Grownups Math for Teachers Math for Writers

Why National Polls Don’t Matter: Electoral college math

This post makes me scared. Not because the math is challenging or because I’m worried about the election. I’m afraid of looking partisan or being accused of ideology. (It’s happened before!) But I can’t avoid election math any longer, so I’ve decided to take the plunge — today and Monday — into these shark-infested waters, trusting that my readers (and new guests) will put away their partisan differences if only for a few hours. Do for the sake of the math.

There’s no denying the math that goes on in elections. There are polls, ad buys, the number of minutes each candidate has spoken during debates — and yes, the electoral college. Whatever you may think of our dear map, it is how elections are decided in this country — for the most part.

There’s no reason to expect a repeat of Election Day (and the weeks following) 2000 this year. So I thought it would be a good idea to review the electoral map — from a mathematical perspective — so that we can better understand its power. First some history.

During the Constitutional Convention in 1787, the founding fathers quickly rejected a number of ways to select the country’s president: having Congress choose the president, having state legislatures choose and direct popular vote. The first two ideas were tossed based on fears of an imbalance of power — giving Congress or the states too much control. They also worried that a direct popular vote would be negatively influenced by the lack of consistent communication. In other words, without information about out-of-state candidates, voters would simply choose the candidate from their own states. And then there was the very real fear that a candidate without a sufficient majority would not be able to govern the entire nation.

So, these fine men drew up a fourth option: a College of Electors. The first design, which is outlined in Article II of the U.S. Constitution, was pitched after four Presidential elections, after political parties emerged. Much of the original system remained, but the 12th Amendment to the Constitution instituted a few changes to reflect the country’s new party system. Here what the electoral college looks like today:

  • The Electoral College consists of 538 electors.
  • Each state is allotted the same number of electors as it has Congress members (Senators and Representatives)
  • Therefore, representation in the Electoral College is dependent on each state’s population. More populous states have more electoral votes; less populous states have fewer electoral votes.
  • The 23rd Amendment to the Constitution gives the District of Columbia 3 electoral votes, event though it is not a state.
  • Each state has its own laws governing how electors are selected. Generally, electors are selected by the political parties themselves.
  • Most states have a “winner takes all” system, which means that the candidate with the majority of the direct popular votes in the state gets all of the electoral votes.
  • However, Maine and Nebraska have a proportional system, which means the electoral votes can be divided between candidates.

Whew!

Some basic calculations allow the media and election officials and the candidates themselves to make really good predictions on election night in most situations. But the electors don’t officially cast their votes until the first Monday after the second Wednesday in December. Then, on January 6 of the following calendar year in a joint session of Congress, the electoral votes are counted, and the President and Vice-President are declared. (Got all that?) Almost always, though, the losing candidate concedes the election on election night or the next day, making the electoral vote and counting a mere formality.

The thing that makes this complex is that each state has a different number of electoral votes. In order to win the presidential election, a candidate must secure at least 270 electoral votes. And that’s why you’re probably seeing a red and blue (and purple?) map in your newspaper, on television and online.

In my state, there is no question which candidate will take all of the electoral votes. Maryland has been staunchly Democratic for several decades. And there’s no mystery about Texas, which is about as red as a state can get. But if it were a contest between Maryland’s and Texas’ electoral votes, Governor Romney would win. That’s because Texas has 38 electoral votes, while Maryland has 10.

Right now, there are lots and lots of predictions out there concerning how the electoral college will vote. (Personally, I think Nate Silver0 of the New York Times is the most reliable source. Dude has a killer math brain, correctly predicting the electoral college outcomes in 49 of the 50 states in the 2008 election. In that same election, he correctly predicted all of the 35 Senate races.) But there’s little doubt about many of the states. A few swing states will certainly claim this election: Colorado, Florida, Iowa, New Hampshire, Ohio, Virginia and Wisconsin. Mathematically speaking, we’re talking about 89 votes:

  • Colorado: 9
  • Florida: 29
  • Iowa: 6
  • New Hampshire: 4
  • Ohio: 18
  • Virginia: 13
  • Wisconsin: 10

Now out of those, which states would you guess the candidates really want to win? Yep, the ones with the highest number of electoral votes. So to them, the most important states in these last days of the campaign are Florida, Ohio and Virginia. (Where do you draw the line? I chose more than 10 electoral votes.)

If you live in one of these three states, you are acutely aware of this fact. Unless you don’t have a television set or listen to the radio or have a (really) unlisted phone number.

So what does this mean? Right now, it means that President Obama is likely to win the election. There are scenarios that show the opposite outcome — and there are even a few that produce a tie. However, most political analysis says that it’s Obama’s to lose at this point. This is despite the fact that most polls show the popular vote at a statistical dead heat (in other words, any lead by either candidate is well within the margins of error).

Because our founding fathers made a decision that we wouldn’t elect our presidents with a direct popular vote. What matters in these last days are the popular votes in the swing states — most importantly Florida, Ohio and Virginia — though there are scenarios that give Mitt Romney the edge without winning all of the swing states.

If you are a complete geek about election numbers, do visit Silver’s FiveThirtyEight blog at the New York Times. His math is good, regardless of what some conservative pundits have claimed in recent weeks.

EDITOR’S UPDATE: Sam Wang of the Princeton Election Consortium also has great analysis. Hurricane Sandy has messed with his servers, so the site looks pretty rudimentary, but he is updating his site regularly. It’s pretty cool to compare Silver’s and Wang’s conclusions — especially on a day-by-day basis.

I also highly recommend a really slick interactive tool put out by the New York Times. It graphically illustrates ways in which the electoral votes could swing the election in either way, based solely on the math. Unlike Silver’s blog, this section does not offer a prediction of who will will win, but describes the various scenarios for each candidate.

Whatever you think of the candidates and the issues, vote. No matter what, vote. Our votes — even outside swing states — matter. It’s our responsibility as U.S. citizens to declare our preferences. And in my mind, if you don’t vote, you can’t complain.

Coming on Monday… a look at the polls themselves. What makes a good poll? How should we average folks interpret polls? Can they really tell us what’s going on?

What are your thoughts on the math of the electoral college? (I get it. These discussions can get heated. Please be respectful in your comments. I will not approve or will delete any comments that I deem outside the bounds of civility. Thank you for playing nice.)
Categories
Math at Work Monday

Welcome Sandy! Meteorology and math

Things are looking bad for those of us in Hurricane Sandy’s path. Like most of my neighbors I spent the weekend cleaning up the yard and cleaning out the local grocery stores. But one thing is certain: In a short while, my electricity will be out, and I can expect to be living like Laura Ingalls Wilder in the city for at least a few days. That means no computer, no internet.

So for part of this week, at least, I’m bringing you some topical (not tropical!) highlights from posts past. First up is my interview with on-air meteorologist, Tony Pann. Here’s how he uses math in his work. (I’m betting he’s pretty darned busy this morning!)

Math at Work Monday: Tony the on-air meteorologist

Tony Pann is an on-air meteorologist for WBAL-TV 11 in Baltimore, Maryland.

I have been a television meteorologist for 22 years. Since 2009, I’ve been working as part of the morning team at WBAL TV.

When do you use basic math in your job?

I use math everyday! The computer models that we use to forecast the weather, are based on very complicated formulas derived from fluid dynamics. The atmosphere acts very much like a body of water, so the same mathematics can be applied to both. Each day, over a dozen different computer models are run predicting the state of the atmosphere at different time frames. An initial set of data is entered at a specific starting time, then the model shows us it’s interpretation of what the state of the atmosphere will be at certain time intervals. For example, the data might be entered at 7 a.m., then the model will predict the temperature, wind speed, and barometric pressure at 10 a.m., 1 p.m. and 4 p.m. Some of these models are short range, and only extend out to 48 hours, while others go all the way out to 365 hours from the starting point!

So let’s say there are 13 models that do this same thing each and every day, two or three times a day. It’s my job as a meteorologist to interpret all of that data, and translate it into the very understandable and reliable seven-day forecast that you see on TV. With so much data out there, the intuition and experience of the forecaster is very important. Since each model takes in the same starting data, but is run on a different formula, they all come up with different answers. For example, one model might say the high temp for today is going to be 45 and another could say 50. Or one could predict 6 inches of snow and the other says 1 inch. It’s my job to decide which one is right and why.

Sometimes I don’t trust any of them, and I’ll do a quick calculation on my own.  Here’s an equation that I can use to calculate the high temp for the day by hand:

I then go on TV, and try and explain it all in an interesting manor — at least that’s the goal.

Did you have to learn new skills in order to do the math you use in your job? 

In order to get a degree in meteorology, you actually have to learn all of the math that the computers are doing to give us those answers. It’s not easy! By the time we are finished, we’re just a class or two short of having a minor in mathematics. It’s great to know what the computers are doing, but I’m glad we don’t have to work it out by hand anymore. If not for the wonderful training in the world of mathematics, I most certainly would not be doing this job.

Do you have questions for Tony? Ask them in the comments section, and I’ll let him know to peek in! He’ll be a bit busy for a while, so be patient!

Categories
Math for Parents Math for Teachers Math for Writers Math Secrets

Saving Face: Avoiding performance math

If there’s one thing most folks assume about me, it’s this: That I am some sort of mathmagician, able to solve math problems in a single bound — quickly, in public and with a permanent marker.

Nothing could be farther from the truth.

I don’t like what I call performance math. When I’m asked to divvy up the dinner tab (especially after a glass of wine), my hands immediately start sweating. When friends joke that I can find 37% of any number in my head, I feel like a fraud. I’m not your go-to person for solving even the easiest math problem quickly and with little effort.

Truth is I really cannot handle any level of embarrassment. And I’m very easily embarrassed. I’m the kind of person who likes to be overly prepared for any situation. This morning, before contacting the gutter company about getting our deposit back because they hadn’t shown up, I had to re-read the contract and literally develop a script in my head. What if I misunderstood something and was — gasp! — wrong about the timeline or terms of our contract?

Oh yeah, and I hate being wrong. About anything.

In short, I’m not much of a risk taker. Unlike many of my friends and some family members, I can’t stand the thought of failing publicly. Imagine writing a math book with this hang up! Thank goodness for two amazing editors, who checked up behind me.

I’m also not a detailed person. Not one bit. I’m your classic, careless-mistake maker — from grade school into grownuphood. I’m much more interested in the big picture, and I am easily lured by the overreaching concepts, ignoring the details that can make an answer right or wrong.

For years and years, I worried about this to no end. How could I be an effective teacher, parent, writer, if I didn’t really care about the details or I had this terrible fear of doing math problems in public? What I learned very quickly in the classroom was this: Kids needed a math teacher like me, to show them that failing publicly is okay from time to time and that math is not a game of speed or even absolute accuracy. (It’s never a game of speed. And it’s frequently not necessary to have an exact answer.)

Two weeks ago, as I sat down with my turkey sandwich at lunch, the phone rang. It was a desperate writer friend who was having some trouble calculating the percentage increase/decrease of a company’s revenue over a year. (Or something like that. I forget the details. Go figure.) She really, really wanted me to work out the problem on the phone with her, and I froze. I felt embarrassed that I couldn’t give her a quick answer. And I worried that I would lose all credibility if I didn’t offer some sage insight PDQ.

But since I have learned that math is not a magic trick or a game of speed, I took a deep breath, gathered my thoughts and asked for some time. Better yet, I asked if I could respond via email, since I’m much better able to look at details in writing than on the phone. I asked her to send me the information about the problem and give me 30 minutes to get back with her.

Within 10 minutes, I had worked out a system of equations and solved for both variables. She had her answer, and I could solve the problem without the glare of a spotlight (even if it was only a small spotlight).

My point is this: Math isn’t about performing. If you like to solve problems in your head or rattle off facts quickly or demonstrate your arithmetic prowess at cocktail parties, go for it. That’s a talent and inclination that I sometimes wish I had. But if you need to retreat to a quiet space, where you can hear yourself think and try out several methods, you should take that opportunity.

Anyone who criticizes a person’s math skills based on their ability to perform on cue is being a giant meanie. And that includes anyone who has that personal expectation of himself. There’s no good reason for math performance — well, except for Mathletes, and those folks have pretty darned special brains.

Do yourself a favor and skip math performance if you need to. I give you permission.

Do you suffer from math performance anxiety? Where have you noticed this is a problem? And how have you dealt with it?

Categories
Math for Grownups Math for Parents Math for Teachers Work

Engineering tops highest-earning degrees — again

With the economy still struggling along and a price of a college degree outpacing ordinary inflation, more and more personal finance experts are suggesting that students choose a major based on its earning potential. And true to form, this year’s American Community Survey data shows that STEM (science, technology, engineering and mathematics) degrees continue to promise much higher incomes than even business degrees. And so today, instead of interviewing someone about how they use math in their job, I thought I’d take a look at this data.

In 2011, 59 million Americans (25 years and older) held bachelor’s degrees. The most popular degree is business (20%), with education coming in second (12%). In fact, those with business degrees were the most likely to be employed. But here’s where the rubber hits the road: those with engineering degrees continue to out-earn business majors by about $25,000 a year (based on median salaries).

Yes, you read that right.

And the hits keep coming (again, based on median salaries): those with mathematics, computer science or statistics degrees earn $13,000 more each year, as do those with physical science degrees. Even if a STEM degree holder was not working in that humanities degree holders were (naturally) at the low end of the earning potential, along with education,

But money isn’t everything. Those in STEM careers are more likely be employed in full-time, year-round jobs. (Curiously, teachers aren’t considered year-round employees, which I think skews the data somewhat.) The mathy/sciencey types are also less likely to be unemployed.

I am not one to suggest that someone get a degree merely for the earning potential. If you don’t want to be an engineer, don’t major in that field. It sounds a little woo-woo, but I firmly believe in the general idea that we should all be following our bliss (and being smart about what that means financially).

Where I think this data matters — big time — is much farther down the educational ladder. Students who learn to love (or at least appreciate) STEM subjects are much more likely to consider these as a field of study. On the other hand, many of you can personally attest to the fact that it’s hard to fall in love with these subjects — and play catch up with the concepts and foundation needed to excel in them — when you’ve learned to hate them or have zero confidence in your abilities.

In other words, the work starts in elementary and middle school. For students reach their real earning potential and for employers to find qualified experts for the jobs that they do have, we really must make STEM a priority in these grades. That doesn’t mean more testing or introducing concepts at a younger age. (In my opinion, those strategies are counterproductive.) It means finding truly gifted STEM teachers who are able to motivate their students and overcome our epidemic of mathematics anxiety and general apathy towards the subject.  It means approaching STEM subjects with excitement and a sense of discovery. It means encouraging, not discouraging, exploration in these subjects.

So I ask you: What are you doing to help with this?

Interested in how things broke down numerically? Here are a few median salaries from the American Community Survey:

  • Engineering, $91,611
  • Computers, mathematics, statistics, $80,180
  • Physical and related sciences, $80,037
  • Business, $66,605
  • Literature and languages, $58,616
  • Education, $50,902
  • Visual and performing arts, $50,484

What do you think? Should college students choose a degree based on earning potential? Or should they “follow their bliss”? How can schools help students develop an interest in the fields that offer a higher earning potential? Share your comments!

Categories
Holidays Math for Grownups Math for Parents

Boo! Scaring up savings at Halloween

I’ve admitted it here before: I’m a dedicated DIYer. Pinterest is a huge playground for me, and I scout craft shows for ideas I can try at home. Like most Martha Stewart wanna bes, I leave a lot of projects undone. It can turn out to be an expensive past time.

After years of this back-and-forth, I’ve realized one important few thing: sometimes DIY is more expensive — in money and time. That’s why I included the following in my book, Math for Grownups. Yes, the example is based on my own, personal experience, except that the ending turned out differently. (The obscure character? Luna of Harry Potter fame.) Had I really thought it through before heading to Joann’s Fabric, I would have saved myself some cash and a lot of time.

Rita loves Halloweʼen, and she loves making her kidsʼ costumes. This year, her 10-year-old daughter has requested a velvet-like cape and gown so that she can dress as some obscure character from her favorite novel about magical kids.

The pattern Rita is using calls for 7 yards of fabric, 2 fancy fasteners, and 3 yards of fringe. Looking at the Sunday circular for the local fabric store, she sees that crushed panne velvet is on sale for $2.99 per yard and the fringe is priced at $4 per yard. Rita guesses that the fasteners are about $5 each. To estimate her costs, she adds everything together:

(7 • $2.99) + (3 • $4) + (2 • $5)

(In case you lost track, that’s 7 yards of fabric at $2.99 per yard, 3 yards of fringe at $4 per yard, and 2 frog clasps at $5 each.)

$20.93 + $12 + $10 = $42.93

A terrifying price!

Rita is starting to think that a trip to a thrift shop might be a better investment of her time and money. Sometimes doing it yourself just isn’t worth it.

Do you have any scary costume stories? How have you learned to save money while DIY and celebrating Halloween?

Categories
Health Math for Grownups

More Vitamin C Please

For the last week, I’ve been suffering from a terrible cold of some sort, which has now taken up residence in my chest. Sometimes I have my voice, sometimes I don’t. Sometimes I sleep, most of the time I don’t. Sometimes I have energy, most of the time I’m sprawled out on my sofa hoping that something watchable will show up on my television set. So, I’m taking the easy way out with a short post today.

Having gone back and forth between the drugstore many times in the last week, I can’t help but wonder how much this whole thing is costing me.

3 cans chicken soup: $1.49 each = $4.47

3 bags Riccola lemon/mint, sugar-free lozenges: $2.05 = $6.15

1 bottle ibuprofen, 80 count: $7.99

1 bottle Delsym 12-hour cough syrup: $11.79

TOTAL: $30.40

At the grocery store today, I bought two bags of oranges for $5. A good night’s sleep is free and so is tap water. Prevention is the cheapest medicine. Lesson learned.

I’ll be back on Friday with a real post — unless I continue to go downhill with this stuff. In the meantime, if you’d like to share your cost-cutting strategies for dealing with or avoiding the common cold, I’m all ears. It’s likely I’ll be reading it at 2:00 this morning, while in the midst of a coughing fit. (Yeah, you should feel sorry for me.)

Oh and if this isn’t enough of a math fix for you, yesterday was Ada Lovelace Day — honoring all of the women who are tops in STEM (science, technology, engineering and mathematics) fields. Share your favorite brainy chick at the Math for Grownups facebook page.

Categories
Math at Work Monday

Math at Work Monday: Wendy the astronaut

Meet Wendy Lawrence, a real, live astronaut who has logged more than 1,225 hours in space. Cool, huh? From 1995 until 2005, Lawrence took four trips into space, including the last Shuttle-Mir docking mission on Discovery. She also took rides in Endeavor and Atlantis. 

And, duh, she used lots and lots of math as an astronaut. She breaks it down below.

Wendy Lawrence

Can you explain what you do for a living?

As a NASA astronaut, first and foremost, your job is to support NASA’s human spaceflight program. For example, one of my jobs in the Astronaut Office was to oversee the training of astronauts who would spend five to six months on the International Space Station (ISS). In this job, I had to work closely with representatives of the other participating space agencies to determine the specific content and length of the training flow.

Certainly, the highlight of being an astronaut was having the opportunity to be assigned to a mission! I was very fortunate to have the opportunity to fly on the space shuttle four times. On my first flight, STS-67, we performed astronomical observations with the three telescopes that we had in the payload bay. My next two flights, STS-86 and 91, went to the Russian space station Mir. My last flight, STS-114, was the first shuttle flight after the Columbia accident and we went to the ISS.

When do you use basic math in your job?

Astronauts use math regularly. We often fly in the T-38 jet for crew coordination training and to travel to other locations for mission training and support. Before every landing, the crew (front seat pilot and back-seater) needs to calculate the landing speed. This requires basic addition, subtraction and division. We subtract 1000 from the current amount of fuel and then divide that number by 100. We then add the result to the basic landing speed (155 kts or knots). Here’s an example:

2000-1000 = 1000

1000 ÷ 100 = 10

Landing speed is 155 + 10 = 165 kts

We also have to use math when we fly the space station robotic arm. This arm was built by the Canadian space agency. They used centimeters to measure distances and centimeters are displayed on the control panel. When NASA astronauts ride on the arm during a spacewalk, they typically measure distances in inches and feet. For example, the space-walker may say that he or she needs to move 12 inches to the right. Knowing that there are 2.5 centimeters per inch, the robotic arm operators can make the conversion to 30 centimeters (typically done in our heads) and then fly the arm to that new location (based on the numbers displayed on the control panel).

Do you use any technology to help with this math?

Typically, we when fly in the T-38 jet or fly the station robotic arm, we don’t use calculators or computers to help us with this math. When your hands are on the controls of the jet or the robotic arm, it is hard to use a calculator!

How do you think math helps you do your job better?

When we fly the T-38, it is a matter of safety. We could quickly get ourselves into trouble if we don’t land the jet at the proper speed.

How comfortable with math do you feel?

I studied engineering in college, so I do feel very comfortable with math.

What kind of math did you take in high school?

I took geometry, algebra II, trig and pre-calculus in high school. I did enjoy math, but I did feel like I needed to work hard to be good at it.

Did you have to learn new skills in order to do the math you use in your job?

Basically, for the situations that I have already described, I could use the math skills that I learned in school.

No surprise that Wendy uses lots of math, right? But I was a little surprised that she used so much mental math. And I didn’t expect her to say that she had to work hard at math in high school. What surprised you? Share in the comments section.

Categories
Personal Finance

Benchmark Your Retirement Savings

On Wednesday, I showed you how to calculate the amount of money you’ll need in retirement — based on a variety of variables, including your pre-retirement income, the percentage of that income that you can live on in retirement and the number of years you expect to be in retirement. I even suggested that you find three or four goals for this — low, middle and high amounts — so that you have some realistic flexibility.

Even better is monitoring this savings along the line. Knowing what you should have already stashed away at age 30 or 40 or 50 can help you stay on track. If you’re behind, you can ratchet up your savings. If you’re way ahead, you can plan to quit your career a little earlier (or just bask in the really soft cushion you’ve created). Keeping an eye on these benchmarks helps you create a better plan.

But these calculations will naturally include a variety of assumptions — from how much you’re putting away in savings to the interest rates or return on investments. There’s no good way to really predict these, but retirement ratios have gotten pretty good reviews from some financial experts.

Retirement Ratios

Charles Farrell (not the silent film star) of Northstar Investment Advisors created a set of multipliers, outlined in his book, Your Money Ratios, that make it really simple to estimate these benchmarks. (In this case, multipliers are merely numbers that you multiply by. In essence they’re parts of proportions.) Like my suggestion to have several goals, Farrell developed bronze, silver and gold standards. (Bronze is 70% of income, retiring at 70 years old; silver is 70% of income, retiring at 65 years old; and gold is 80% of income, retiring at 65 years old.) His website and book detail these standards and benchmarks in really handy tables.

Basically, Farrell offers multipliers for each standard and each age. Pull the multiplier from the table, multiply it by your salary and — viola! — you have easily calculated a good estimate for how much you should have already saved by that age and for that standard.

Let’s look a simple example: retiring at age 70, with 70% of your income. And let’s say you earn $50,000 a year.  Here are four multipliers from Farrell’s tables: 30 years old at 0.45, 40 years old at 1.6, 50 years old at 3.5, 60 years old at 6.5 and 70 at 10.

30 years old: $50,000 • 0.45 = $22,500

40 years old: $50,000 • 1.6 = $80,000

50 years old: $50,000 • 3.5 = $175,000

60 years old: $50,000 • 6.5 = $325,000

70 years old: $50,000 •10 = $500,000

It’s not at all clear how Farrell came to these multipliers. (And I’m certain, like KFC’s secret recipe, he’s going to keep much of that to himself.) But, mathematically speaking, there’s something interesting to notice here. Your benchmarks are 10 years apart, but the difference between each goal is not a constant number. In other words, the difference between each consecutive year is not the same number.

Why is that? Well, if you think of the graph of compound interest, you’ll come to the answer quickly. Because compound interest is a curve, it increases quickly. This is a great thing when you’re dealing with savings. (It’s not so good with credit.) And if you look at the difference between each benchmark, you’ll see that over time, you’re retirement investments and savings are increasing by more and more.

And this should make perfect sense, if you look at the multipliers. These are not increasing in a constant way, either.

1.6 – 0.45 = 1.15

3.5 – 1.6 = 1.9

6.5 – 3.5 = 3

10 – 6.5 = 3.5

Each difference is slightly larger as you go up in age. If you were to graph the age and multiplier (or even product) on a coordinate plane (x-y axis), you’d have a curve.

The bottom line is this — as you age, you want your nest egg to increase exponentially, rather than linearly. In other words, you want your total to increase quickly, so that you can reach your retirement goals before you’re too old to take advantage of them.

What do you think of this process? How would having these benchmarks help you monitor your retirement savings more closely? Do you think it would be helpful to use these multipliers in your planning? Share your responses in the comments section.

Categories
Personal Finance

Saving for Retirement: How Much? When?

With a presidential election comes big speeches about Social Security and Medicare. But if you’re a cynical 40-something (or younger) like me, you’re not planning on being able to depend on those programs being viable in 20 or more years. Nope, I figure my ability to retire will rest entirely on my shoulders.

But what does that mean? How much will I need to squirrel away for my golden years? Turns out the experts offer some advice.

First off, you won’t need 100% of your salary when you retire. Depending on their situations, most retirees live on between 70% and 80% of their pre-retirement incomes. Once you decide on that percentage, you can easily calculate the amount you’ll need to have on hand when you retire.

(Editor’s note: A reader let me know that it’s unclear what I mean by savings. For our purposes here, I’m discounting Social Security and pensions, since most of us don’t have pensions and there’s no guarantee that Social Security will still be around. At the same time, I am including investments like IRAs and 401K plans. These have largely replaced pension plans and are the most often recommended ways to save for retirement. Now back to our regularly scheduled program.)

Let’s say that you earn an even $50,000 each year. You’re a conservative sort, who figures that having 80% of that each year is a better cushion. Find 80% of $50,000 to find your annual retirement income. (In case you’ve forgotten, of means multiplication in this situation. So you’ll need to multiply 80% — or 0.8 — by $50,000 to get your final answer. Using a calculator works just fine.)

80% of $50,000

0.8 • 50,000 = 40,000

In this scenario, you’re shooting for $40,000 in the bank for every year you are retired. And that’s where the tricky part comes in. There’s no way to know for sure how many years of retirement you’ll actually have. People are living longer, which is one reason that the actual retirement age is creeping up.

But let’s assume that you are expecting the average 20-year retirement. (That sounds heavenly!) The rest of the math is incredibly simple. Just multiply the annual retirement income by the number of years:

$40,000 • 20 = $800,000

Yep. You read that right. With a modest $50,000 annual income, it’s reasonable to expect you’ll need $800,000 in the bank before you can spend your days volunteering at the hospital gift shop or planting daisies. (This is why most folks can’t afford to retire.)

So with just these simple calculations, let’s play with the numbers. What if you reduce the percent to 70% and keep the retirement time the same?

0.7 • 50,000 = $35,000

$35,000 • 20 = $700,000

What about keeping the percent the same and reducing the retirement time to 15 years?

0.8 • 50,000 = $40,000

$40,000 • 15 = $600,000

Let’s try one more idea: reducing both the percent and retirement time.

0.7 • 50,000 = $35,000

$35,000 • 15 = $525,000

This exercise isn’t really a waste of time. (I promise.) With these four figures, you have several goals to shoot for — lowest, middle and highest goal. (Of course, having even more than $1.2 million is just fine.) And with those three goals comes more flexibility in your savings options. If you shoot for 70% of your pre-retirement income and plan to spend 15 years in retirement, you’ll need $525,000 in savings. If you shoot for 80% and 15 years, you’ll need $600,000. At 70% and 30 years, you’ll need $700,000, and at 80% and 30 years, you’ll need a cool $800,000.

Of course deciding where to invest or save your hard earned cash is a whole ‘nother ball of wax. But knowing what you’re shooting for is a great start. Otherwise, you could miss the retirement boat completely.

Come back on Friday to get the scoop on benchmarking your retirement savings. In order to meet your goals, how much should you already have in savings at 30 years old? 40 years old? We’ll check the math.

Were you surprised to see these figures? Where they higher than expected or lower? Share your thoughts in the comments section.

Categories
Math at Work Monday

Math at Work Monday: Greg the weightlifting coach

I’m of the age when I should be lifting weights — to help manage my increasingly decreasing metabolism and ward off bone density loss. And actually, I like strength training. But not as much as Greg Everett, founder of Catalyst Athletics and Olympic-style weightlifting coach. The author of  Olympic Weightlifting for SportsGreg is considered an expert on this sport, which requires quite a bit of calculations. Take a look.

Can you explain what you do for a living? 

As a coach for my competitive weightlifting team, most of my time is spent creating training programs for my weightlifters and coaching them during their daily training. I also write and edit books, as well as program our website.

When do you use basic math in your job?  

I use math every day. Most commonly, I use it to calculate training weights based on percentages of a lifter’s maximum lift, or to calculate a percentage based on the weight used. I also have to convert pounds to kilograms often; the sport of weightlifting uses kilograms officially, but sometimes individuals only know weights in pounds. During program design, I also use math to calculate other figures like volume (in this case, the number of repetitions performed in a given time period) to allow me to track and plan a lifter’s training. And of course, I have to be able to add the weights on the barbell quickly to know what a lifter is lifting. In weightlifting, weight plates are color coded to make this easier.

Do you use any technology to help with this math?

I do use a calculator frequently during program design for calculating percentages because I need it to be accurate. Calculations of volume are done with functions in the Excel spreadsheets I use to write programs. I normally do pound/kilo conversions in my head as much as possible just for the sake of practice.

How do you think math helps you do your job better?

Understanding some fundamental math concepts allows me to design better training programs and develop my weightlifters more successfully. Without math, there would be too much guesswork, and training athletes to high levels of performance requires accuracy.

How comfortable with math do you feel?  

I didn’t particularly enjoy math as a student, although I never struggled with it. I’m comfortable with the math I use frequently in my work and am fairly comfortable with basic algebra, geometry and the like. I feel like I have the math tools to be able to solve problems in life well, but certainly any more complex math I learned as a student has been forgotten simply because I don’t use it often enough.

What kind of math did you take in high school?  

Just the standard algebra and geometry; I didn’t take any advanced math courses in high school and was an English major in college. I felt that I was good at math to the degree that I was interested. That is, I never struggled with the concepts or the execution, but I also didn’t push myself beyond what I needed to learn. In retrospect, I wish I had put more time and effort into math and the sciences in school to build a better foundation.

Did you have to learn new skills in order to do the math you use in your job? 

I didn’t need to learn anything new for my job; what I learned in school was adequate. As I mentioned previously, I wish now that I had more exposure to more advanced math and science as a young student. At that time, I wasn’t interested enough to pursue it beyond basic requirements, but at that age you can’t predict well what you’ll end up doing in life. My advice to students would be to put as much time and effort into your schooling as possible because that time will be your greatest opportunity to learn. You can certainly regret not knowing enough, but you’ll never regret knowing more than you need.

Even jocks use math! Do you use math in your exercise program? Share your experiences in the comments sections — along with any questions you have for Greg. I’ll ask him to swing by and respond!

Categories
Math for Grownups Math for Parents Math for Teachers Math for Writers

Math at Work Monday: Joe the Platform Consultant

In the IT field, there are many machines and programs that are really confusing and difficult to understand. Not only do we have to trust and depend on these machines, but also the people who service them. Joe Thompson is one of the good guys. He provides assistance to the users and companies when they need it most. From consulting to maintenance, Joe and his colleagues are there for us when our technology isn’t working quite right. (Joe is also one of my former geometry students. It’s been great to reconnect with him and see how accomplished he is now!)

Can you explain what you do for a living?

Red Hat’s consultants help customers get our products working when they have specific needs that go beyond the usual tech support.  We are essentially advanced computer system administrators on whatever our customers need us to be to get Red Hat’s products to work for them.  Common consulting gigs are setting up Red Hat Satellite to manage the customer’s servers, or doing performance tuning to make things run faster or a “health check” to verify things are running as efficiently as possible.

We just put out a marketing video about our consulting for public-sector clients, actually:

https://www.youtube.com/watch?v=eMzANG3Yhlk(We do more than just public sector and cloud, of course.)

When do you use basic math in your job?

The most common is when tuning a system to perform well, or configuring various things.  Unit conversions and base conversions are especially important.

IT has a long-running math issue actually: does “kilo” mean “1000” (a round number in base 10), or “1024” (a round number, 10000000000, in base 2)?  There are various ways people try to indicate which is intended, like using a capital K vs. a lowercase k, or using KiB vs. KB.  This matters in a lot of cases because when you get up into large data sizes, the difference between round numbers in base 10 and base 2 gets pretty big.  A 1-TB hard drive (a typical size today, maybe even a little small) is a trillion bytes — 1000 to the fourth power, not 1024 to the fourth power.  The difference is about 10% of the actual size of the drive, so knowing which base you’re dealing with is important.

Then there are units that have to be converted.  A common adjustment for better performance is tweaking how much data is held in memory at a time to be transmitted over the network, which is done by measuring the delay between two systems that have to communicate.  Then you multiply the delay (so many milliseconds) by the transmission speed (so many megabits or gigabits per second) and that gives the buffer size, which you have to set in bytes (1 byte = 8 bits) or sometimes other specified units.Sometimes software writers like to make you do math so they can write their code easier.  If a program has options that can either be on or off, sometimes a programmer will use a “bitfield” — a string of binary digits that represent all the options in a single number, which is often set in base 10.  So if you have a six-digit bitfield and want to turn off everything but options 1 and 6, you would use the number 33: 33 = 100001 in binary.

Do you use any technology (like calculators or computers) to help with this math? Why or why not?

I’ve always done a lot of arithmetic in my head and I can at least estimate a lot of the conversions without resorting to a calculator.  I’ll break out the calculator if the math is long and tedious though, like averaging a long column of numbers, or if I need a precise answer quickly on something like how many bytes are in 1.25 base-10 gigabits — I can do the billion divided by 8 and come out with 125 million bytes per base-10 gigabit, and then multiplying by 1.25 I know I’m going to be in the neighborhood of 150 million bytes, but I need the calculator to quickly get the exact answer of 156250000 bytes.  If I’m on a conference call about that kind of thing I’ll use the calculator more than otherwise.Google introduced a new feature a couple of years ago that will do basic math and unit conversions for you, so if I’m deep into things or just feeling lazy I can also just pull up a web browser and type “1.25 gigabits in bytes” in the search bar, and Google does it all for me.  But recently I noticed I was reaching for the calculator more, and arithmetic in my head was getting harder, so I’ve been making a conscious effort to do more head-math lately.

How do you think math helps you do your job better?

Without math, I couldn’t do my job at all 🙂 Even so little a thing as figuring out how long a file will take to transfer takes a good head for numbers.  As soon as you dig under the surface of the operating system, it’s math everywhere.

How comfortable with math do you feel? Does this math feel different to you ?

I’m pretty comfortable with math.  A lot of my off-time hobbies touch on computers too so it’s a lot of the same math as work even when I’m not working.

What kind of math did you take in high school? Did you like it/feel like you were good at it?

I took the standard track for an Advanced Studies diploma from grades 8-11 (Algebra I, Geometry, Algebra II, Advanced Math), plus AP Calculus my senior year, and always did well. I didn’t expect to like Geometry going in because it’s not one-right-answer like a lot of math, but I ended up enjoying the logical rigor of proofs.  (Though I do recall giving my Geometry teacher fits on occasion when my proofs took a non-standard tack…)

Did you have to learn new skills in order to do the math you use in your job? Or was it something that you could pickup using the skills you learned in school?

Most of it was learned in school, although base conversion isn’t something we spent a lot of time on.  I got good at it through long, frequent practice as you might guess…

Do you have a question for Joe? Send me your question and I will forward it to him.

Photo Credit: Dan Hamp via Compfight cc

Categories
Personal Finance

Real Savings Has Curves: The difference between simple and compound interest

What’s the most common math question I get from grownups? Easy: What’s the big deal about compound interest? For some reason, this idea stumps some very smart people. But the whole thing is pretty simple really. (Ha!) It all comes down to one concept — curves vs. lines.

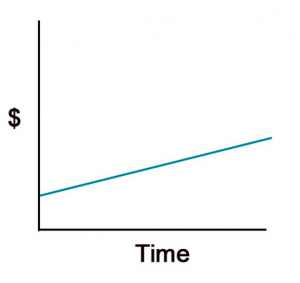
You probably know that simple interest is, well, simple. That’s because it’s linear. (Stay with me here. I promise it’s not too hard.) In other words, simple interest can be described as a line. Now in mathematics, lines are very specific things. They go on forever, for one thing. For another, they’re straight. So while I might casually use the word “line” to describe a squiggly while I’m doodling, that’s a huge no-no in math. Among the Pythagorii and Sir Isaac Newtons, there’s no such thing as a “straight line.” By definition, a line is straight, not curved.

Because simple interest is linear, it increases (and decreases) steadily. Remember graphing linear equations? Take a look:

Graph courtesy of MoneyTipCentral

The graph above is an example of simple interest. As time goes on (or as you look to the right on the “time” axis), the money, $, increases. And it increases very steadily. If you can remember back to your algebra class, you know that each point on this line is found by taking the same steps — x number of “steps” to the right and y number of “steps” up. This is consistent. In other words, you don’t take 2 steps to the right and 1 step up and then 2 steps to the right and 4 steps down. (If you were really paying attention in algebra class, you might remember that this is a way of describing slope, which indicates the steepness of the line.)

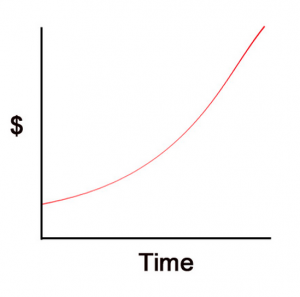
Now curves are different. And, yep, you guessed it, compound interest is a curve. Here’s a general example:

Graph courtesy of MoneyTipCentral

If you looked at three points on this graph, you would find that the way to get from the first to the second to the third is not a consistent series of steps. There would be a pattern, yes, but it wouldn’t be the same each time. This is what we call a non-linear equation, because, well, it’s not linear. (Duh.)

But what can these graphs tell us? It’s not as hard as you might think. Take a look at the graphs themselves. As time increases, so does the money, right? (In other words, as you move to the right along “time” the graph moves up along “$.”) But with the curve, the $ gets bigger faster. It takes less time for the money to increase along the curve than it does along the line. (Follow me? If not, take a closer look at the graphs.)

That’s because of one simple fact: with compound interest, the interest is accrued on the principal (or original amount) and the interest. Each time the interest is calculated, the interest from the previous time period is added to the amount. On the other hand, with simple interest, the interest is accrued on the principal alone. That translates to a steady increase over time, rather than a sharp increase, like with the curve.

So what does this matter? Well, it depends on whether your spending or saving. Since with compound interest, the amount accrues faster over time, this is a good thing for savings or investments — but a bad thing for credit. And it’s the other way around for simple interest.

(Of course that is all moot, since unless you’re borrowing from good old dad, simple interest is pretty hard to come by.)

The point is this: if you can remember that simple interest is a line and compound interest is a curve, you will likely remember how simple and compound interest are figured — slow and steady or speedy quick.

Do you have questions about compound or simple interest? Is there another way that you remember the difference? Share your ideas in the comments section.